Unifying legacy migration workflows to simplify VM mobility.
By the time the plan was ready, it was already out of date.
IT administrators migrate hundreds of VMs at a time — consolidating datacenters, adopting cloud, or refreshing aging hardware — usually against a fixed maintenance window. The work was split across two legacy tools: Net Ops (Aria Operations for Networks), a network-analysis tool, to plan the migration, and HCX, VMware's migration engine, to run it.
The handoff
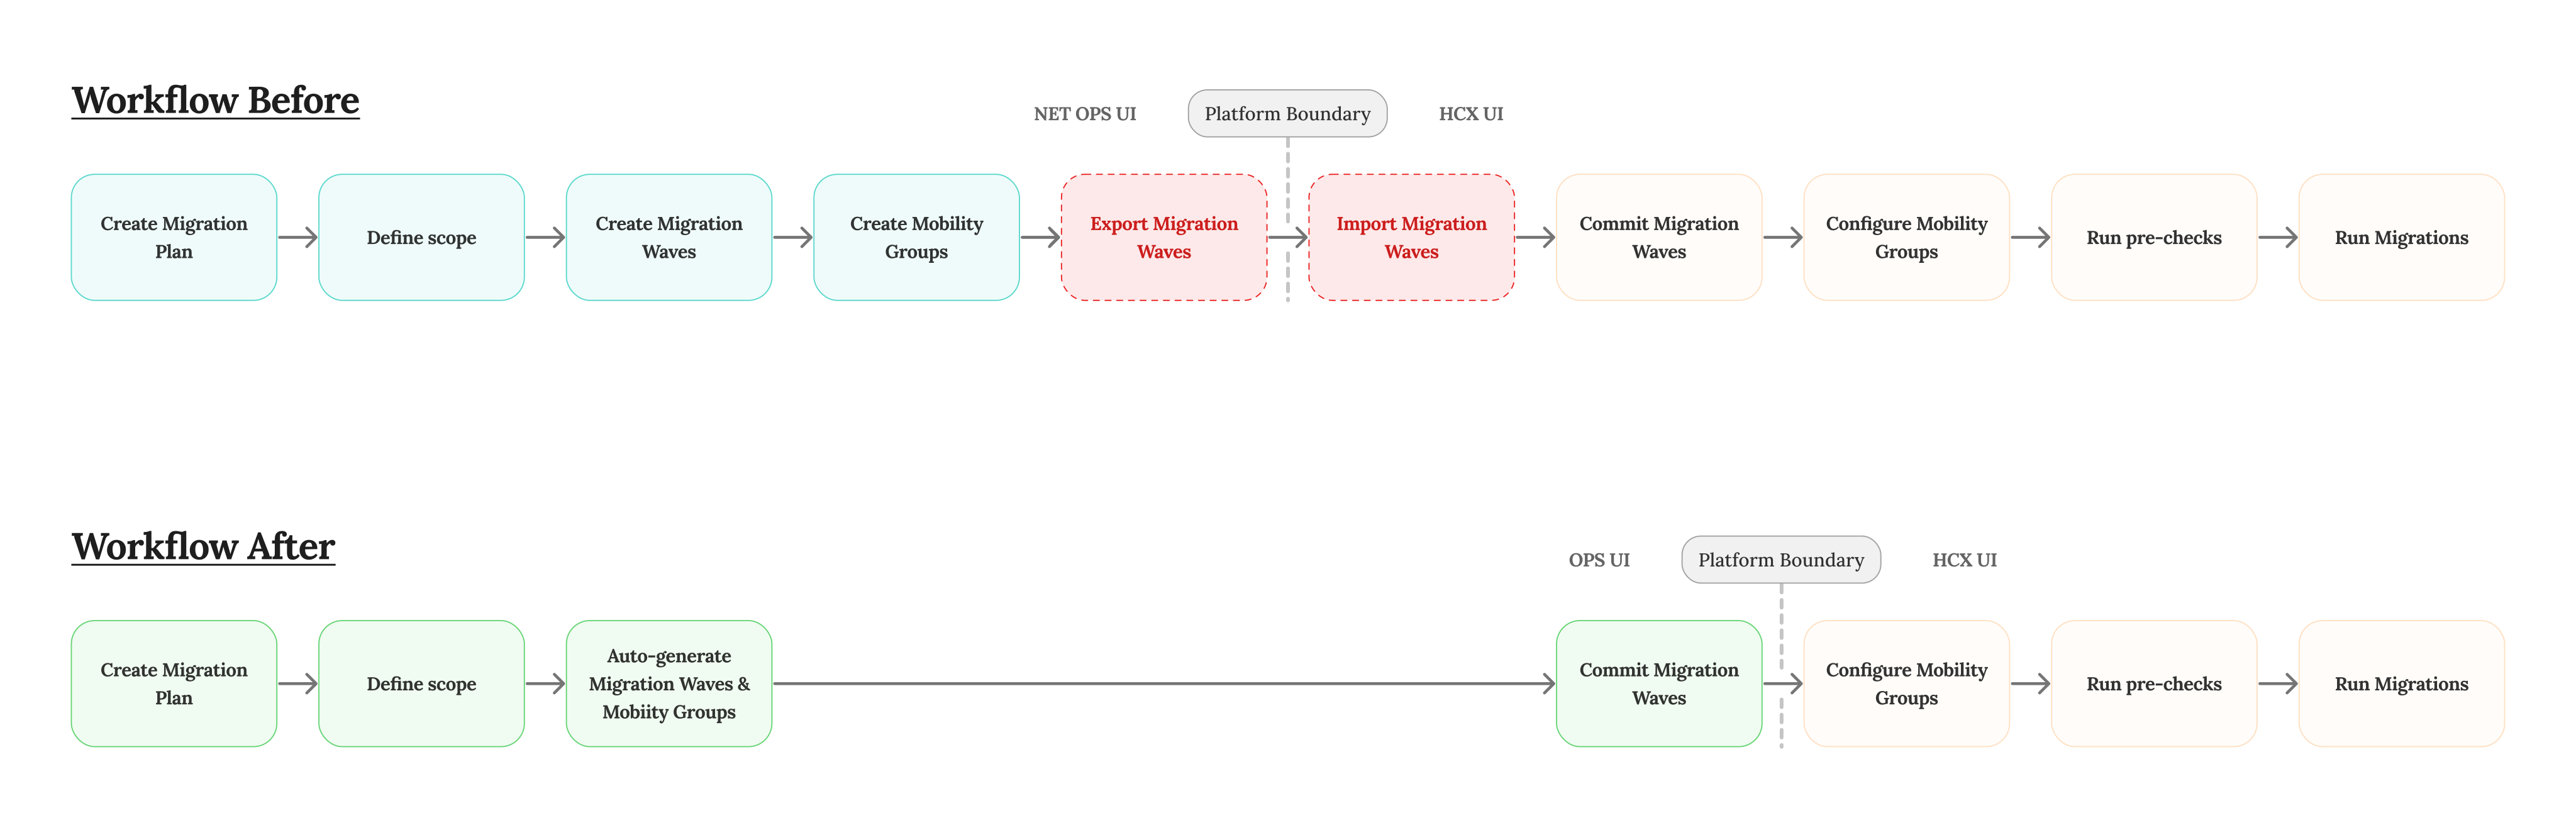
Admins sorted VMs by hand into waves — batches sized to fit a maintenance window — and each wave into mobility groups, usually the VMs of one application that must move together. Then they exported each wave from Net Ops individually, imported it into HCX, and committed it there. Manual grouping invited mistakes: a stray VM, or a whole batch, landing in the wrong wave.
The blind spot
Net Ops showed network dependencies, but not what the destination could hold. Admins pieced together cluster capacity and downtime tolerance from other monitoring tools, internal systems, and third-party utilities. Meanwhile the environment kept moving — teams spin VMs up and down constantly — so by the time a plan was finished, its dependency and capacity data could already be stale.
A wrong or stale plan meant workloads left half-moved when the window closed — downtime the business hadn't budgeted for. The handoff was the problem we could fix first. The blind spot was harder, and it shaped everything that came after.
From fragmented handoffs to one connected workflow.
As design lead, I owned the UX strategy for rebuilding migration planning into the Ops Console (VCF Operations), the platform's modern management UI — one workstream in leadership's broader retirement of the legacy Net Ops UI. Phase 1 fixed the handoff and started on the blind spot; Phase 2 took the blind spot on in full.
Streamlining the end-to-end workflow
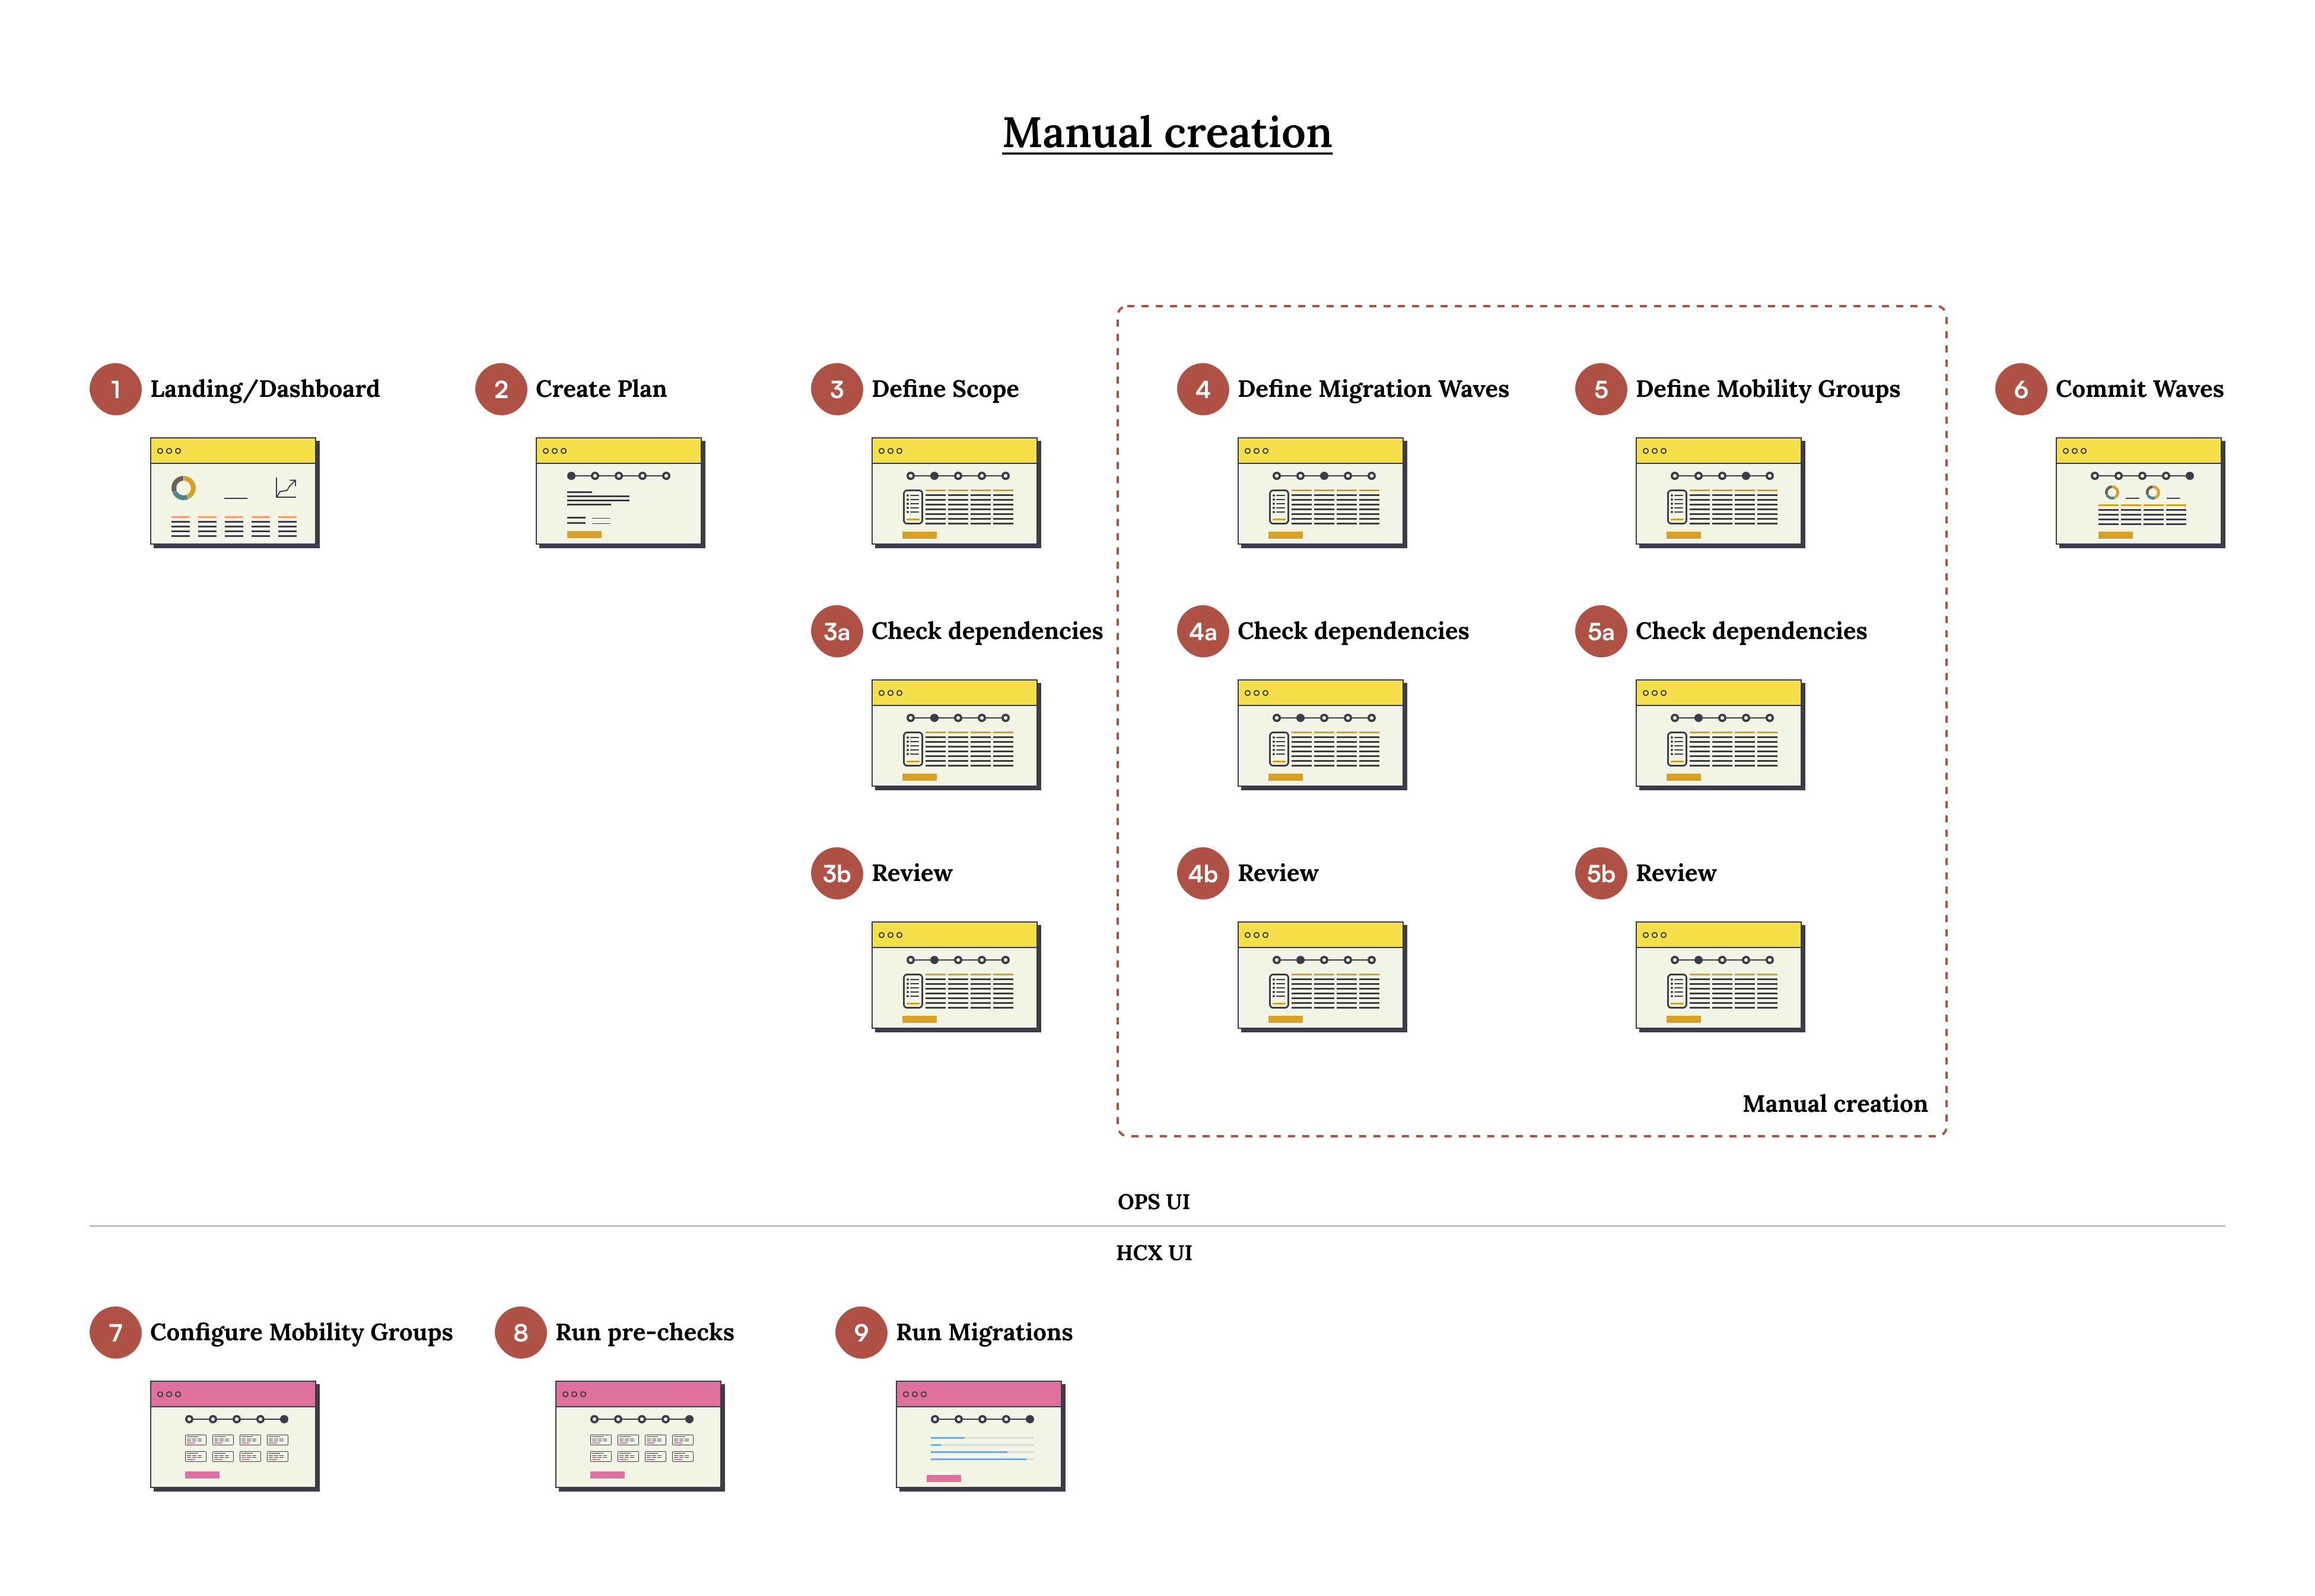
Working with product and engineering, I mapped the full journey and framed the strategy around tighter integration between Net Ops and HCX — to make manual export and import unnecessary in the common case, reduce user burden by auto-generating waves and groups (manual grouping stayed available), and pull the "Commit" action across the platform boundary into the Ops Console. Manual export and import remained as a fallback for when Net Ops and HCX weren't connected. This first phase closed the handoff friction between the two tools; the destination-capacity visibility gap came next — first through the persistent summary widget introduced during plan creation, then more fully through the multi-cluster capacity analysis in the platform's longer-term vision.
Engineering proposed two actions: "send" the waves to HCX, then "commit" them again inside HCX. I argued against it — the legacy flow had no "send" step, and splitting the handoff would force operators to commit a second time, once in each tool. I pushed for a single Commit, done once from migration planning, that sends the waves into HCX and commits them – so no second commit is needed.
Mapping the schema, screen by screen
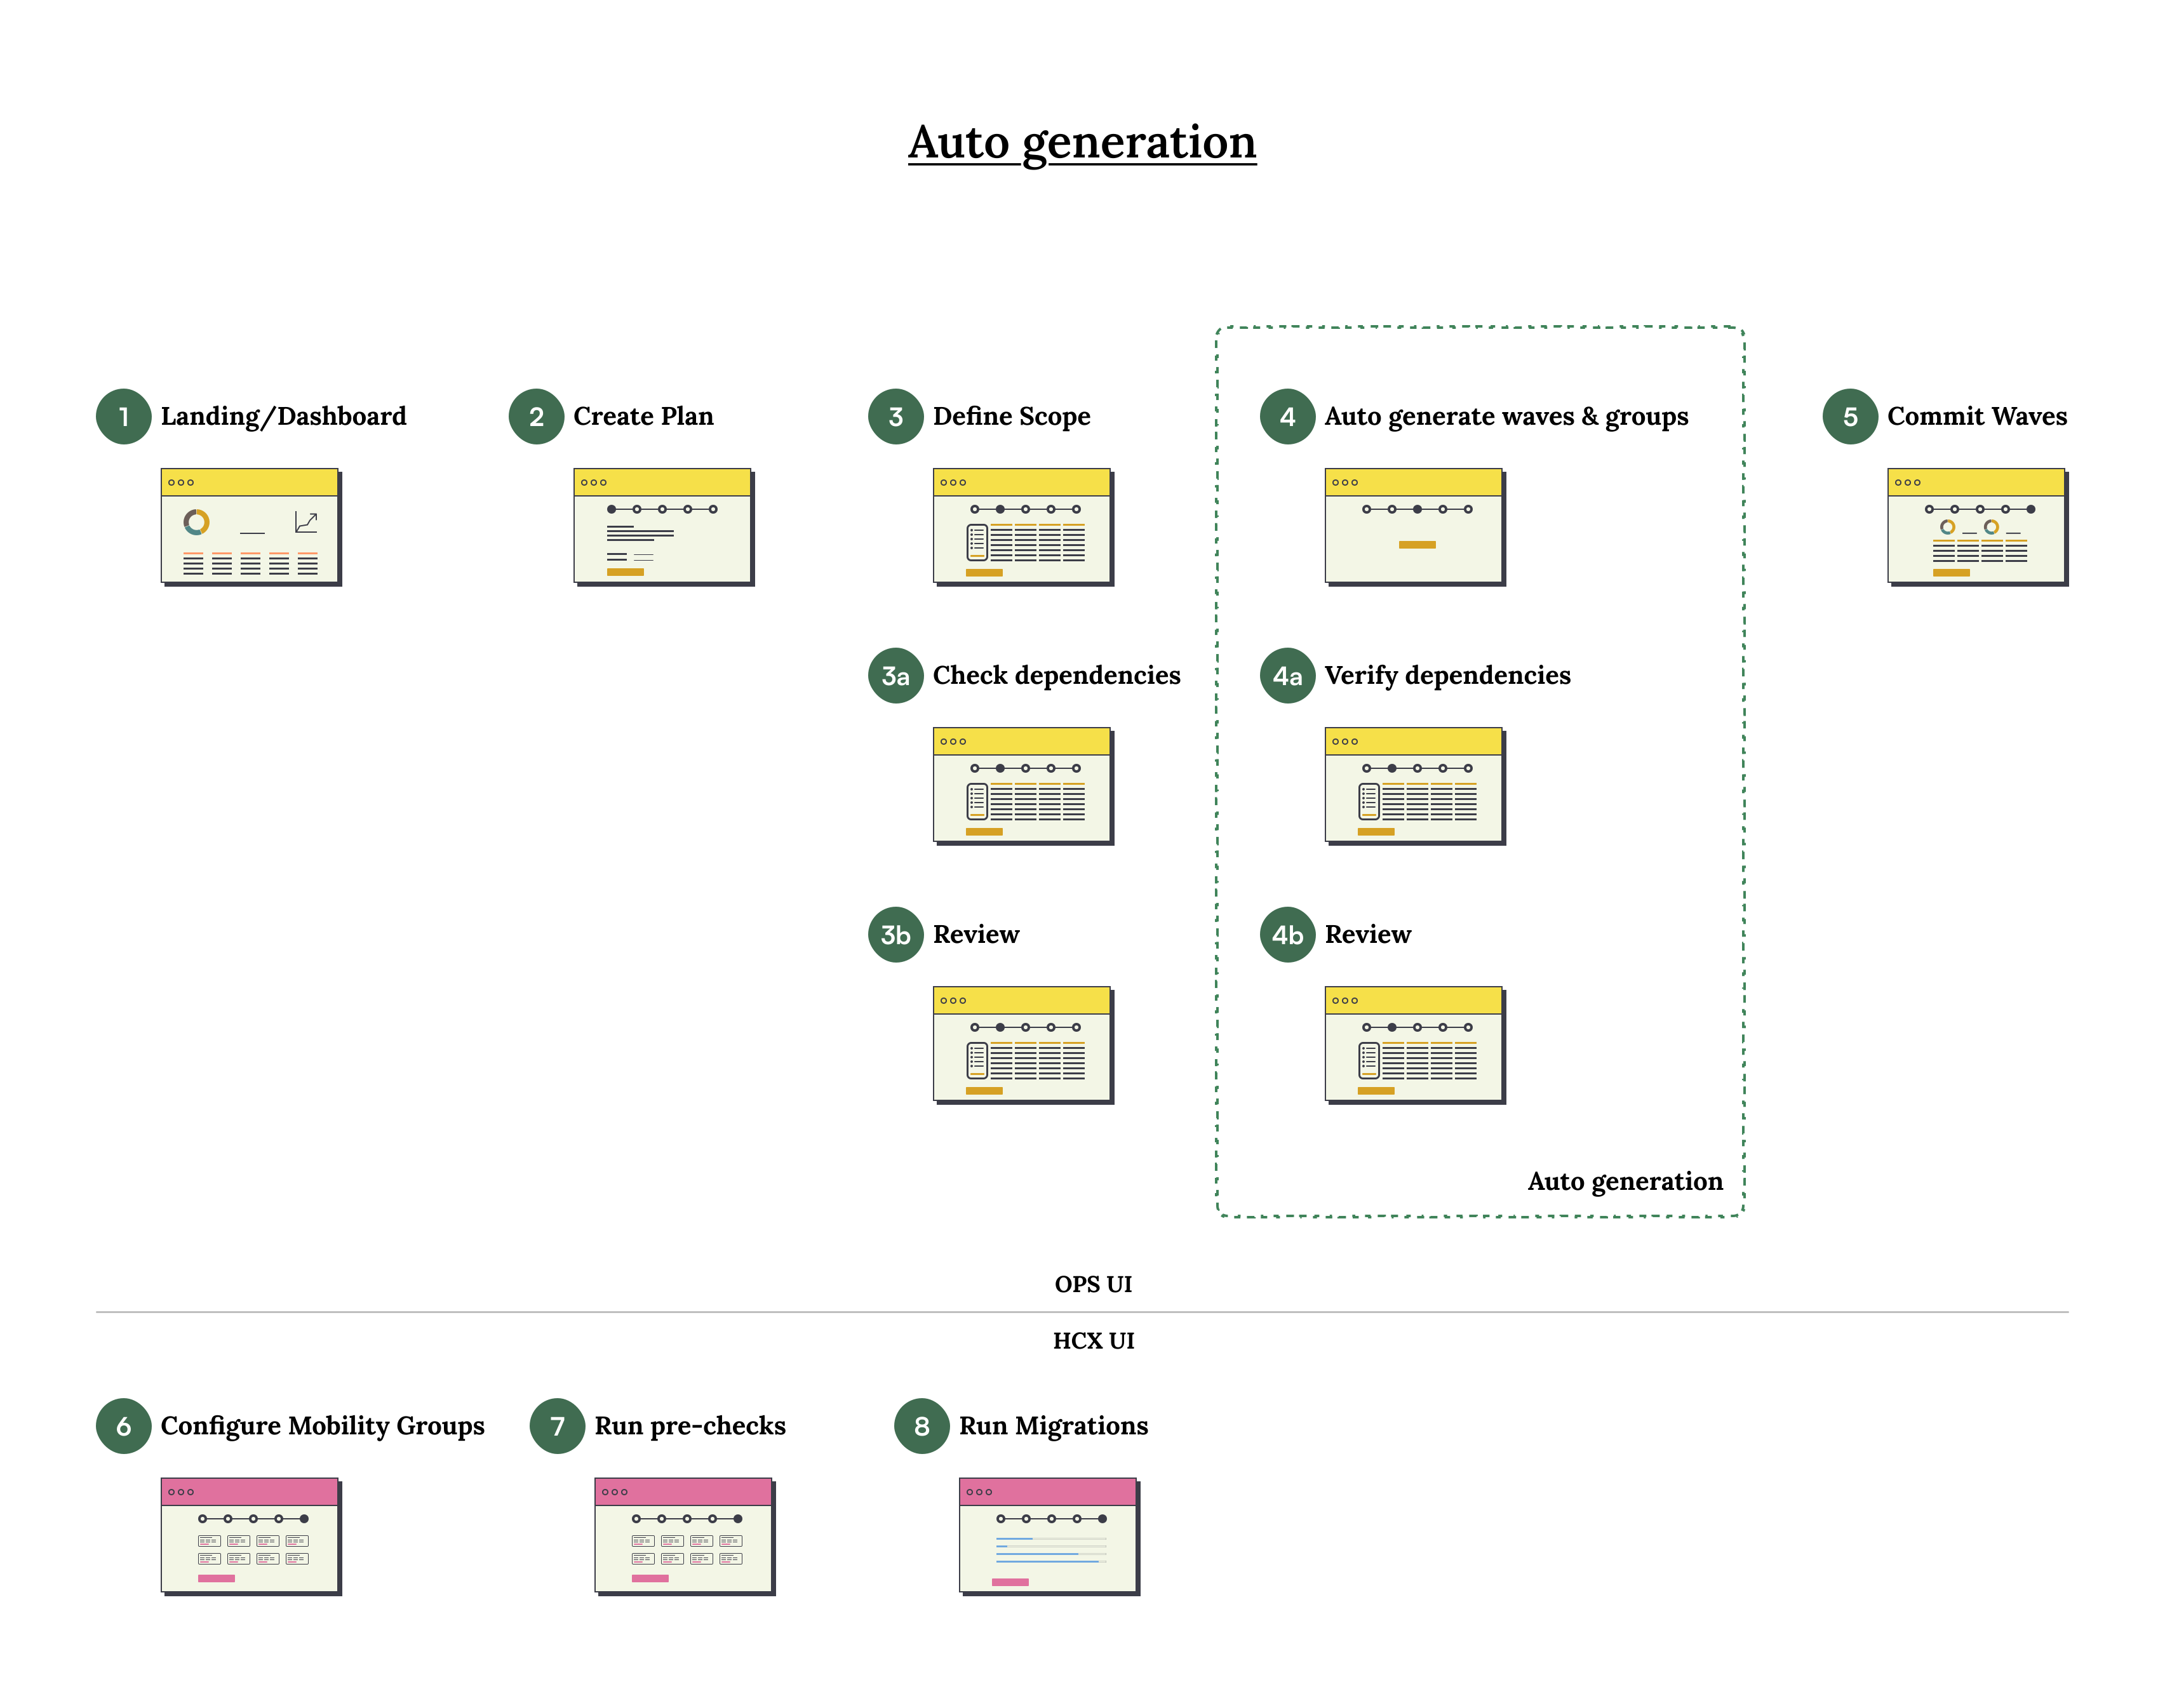
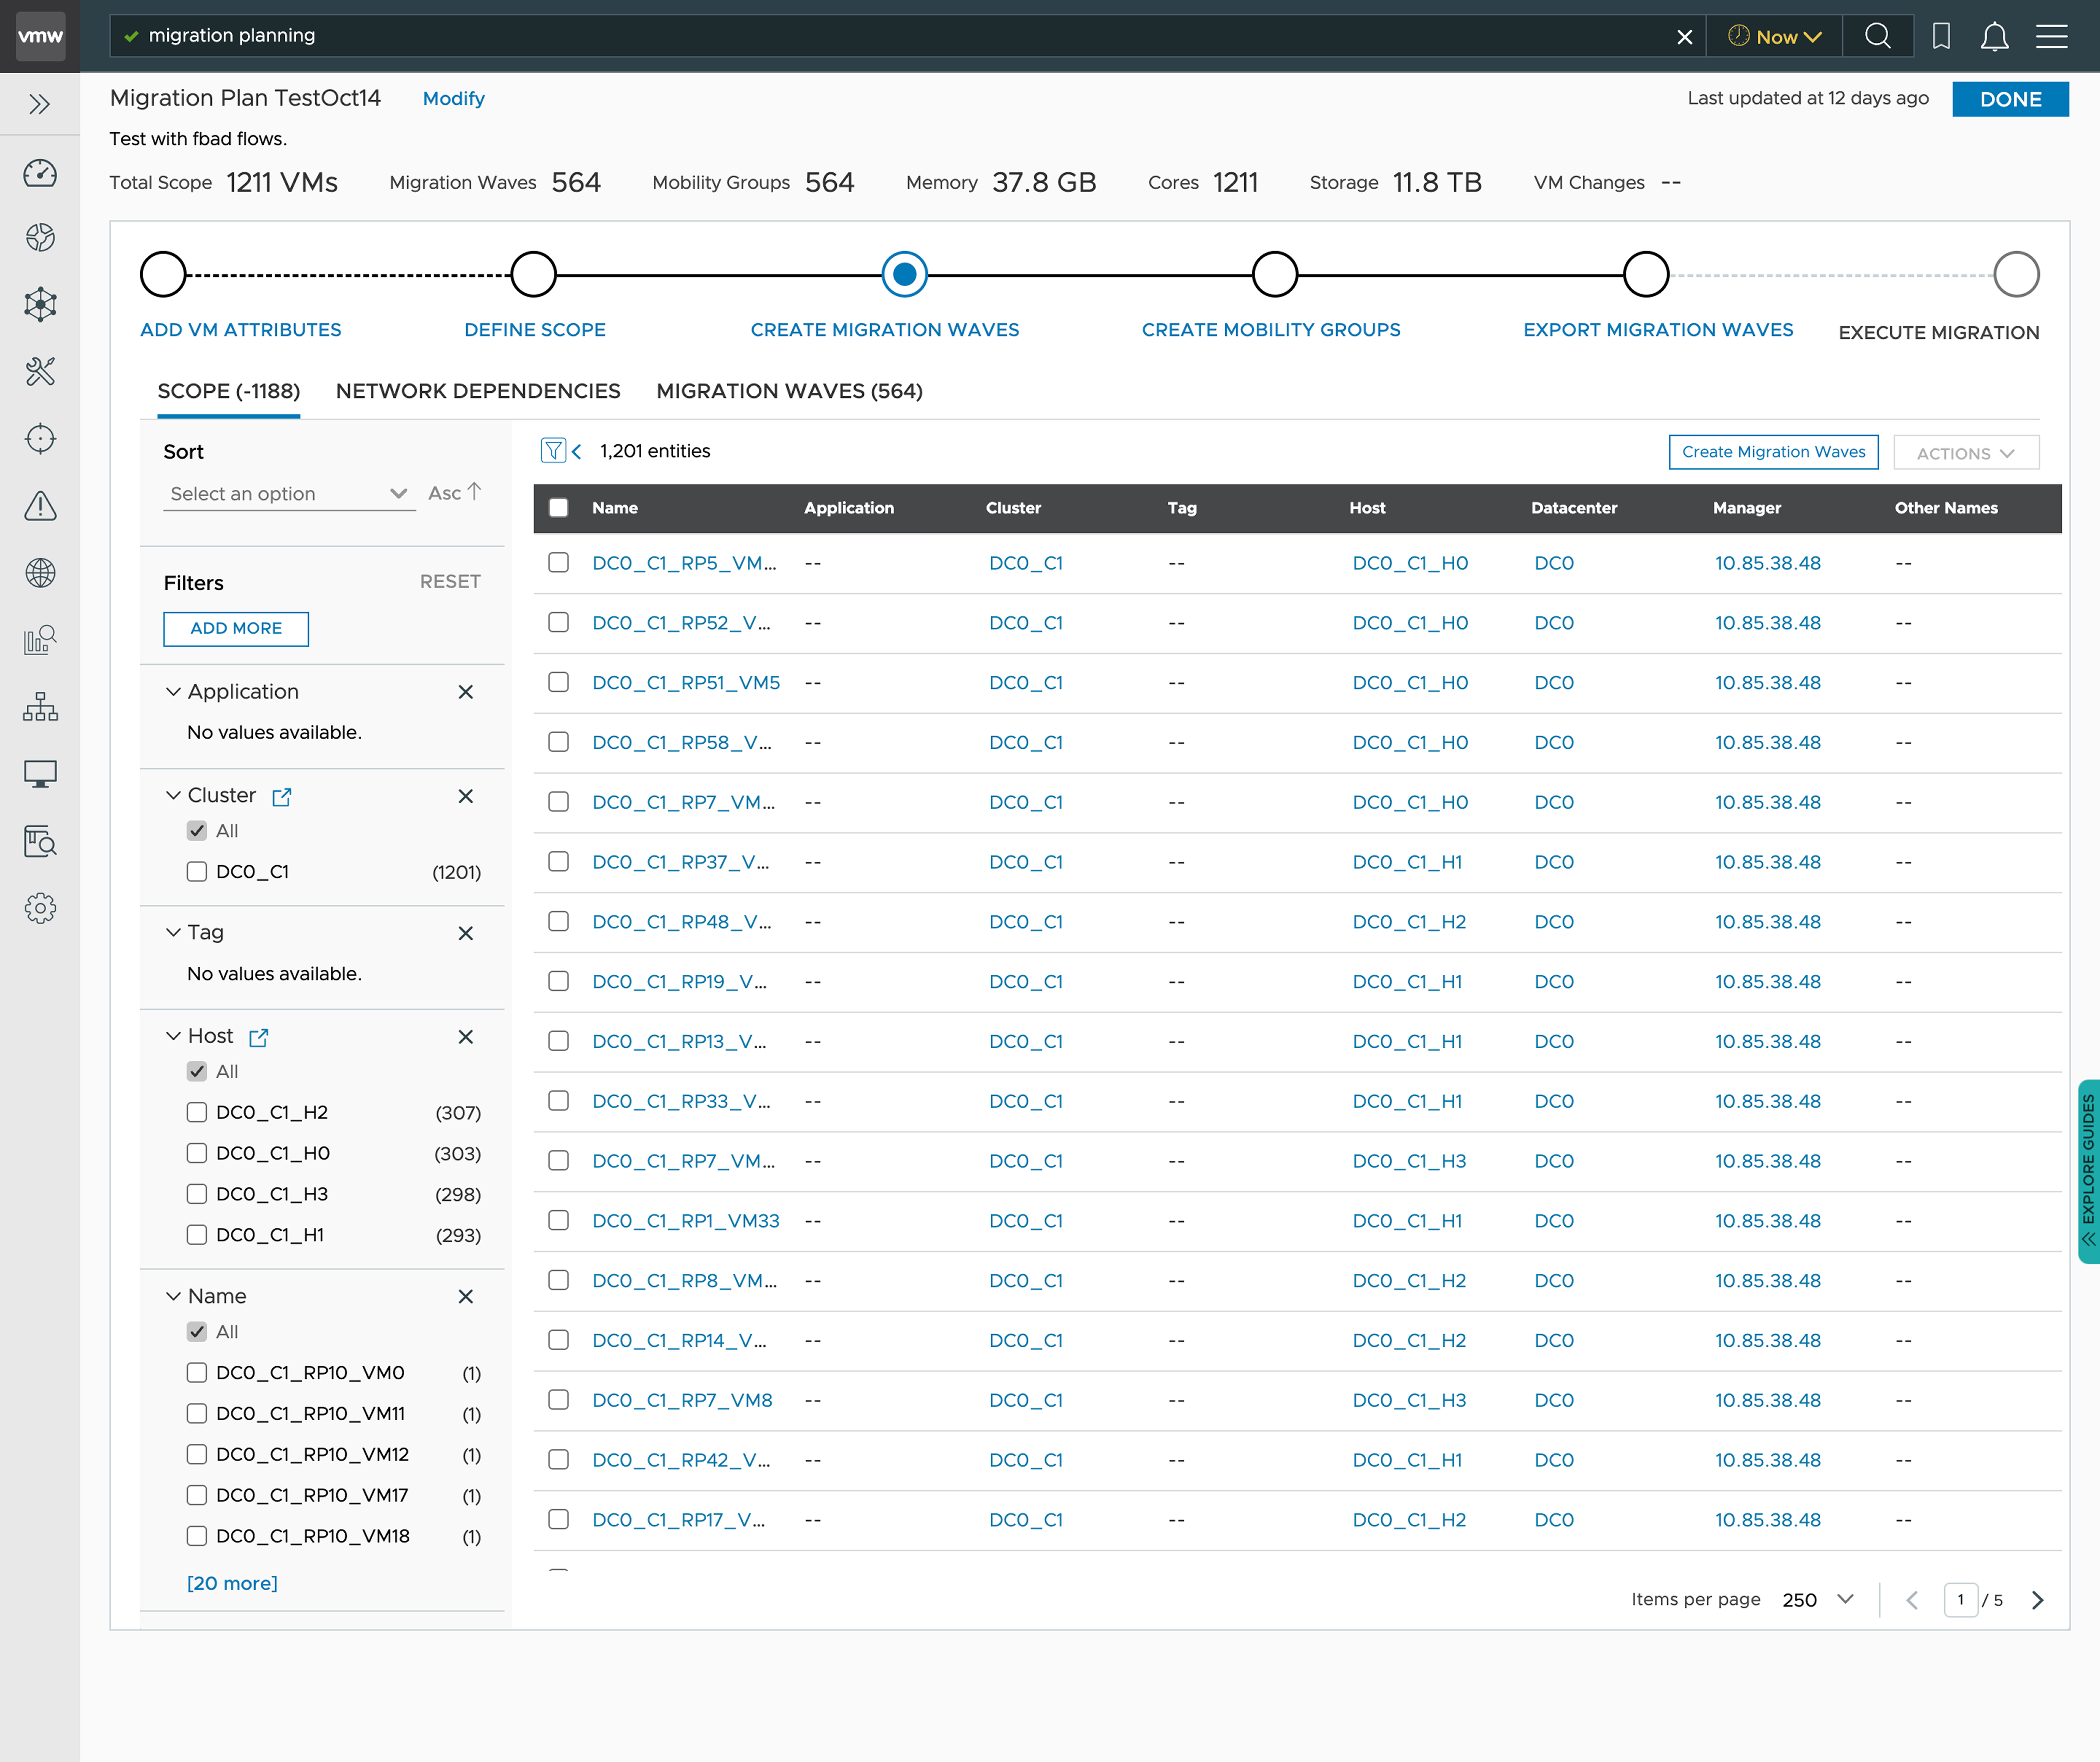
Once the workflow was understood, I laid out the entire user-journey schema screen-by-screen to see the full scope and the sub-steps involved. This helped compare the efficiency of the auto-generation feature — and surfaced a critical insight from research: users were unlikely to adopt auto-generation unless the underlying logic considered criteria beyond just network dependencies.
What the enterprise operators surfaced.
Network Mapping
Need global network mapping to avoid per-VM setup.
Want mapping at site › group › VM levels.
Confused by optional network mapping.
Migration Workflow & Controls
Transfer & Switchover should be separate & user-controlled.
Unclear that Switchover starts automatically.
Prefer local time zone for scheduling.
Guidance & Clarity
Destination settings at group level are confusing — label them clearly.
Need guidance on which migration types require VM restart.
Prefer icons for reset — the circle arrow looks like refresh.
Scale & Performance
Large-scale users (10,000+ VMs) depend on API migrations. UI still helpful for smaller sets.
Need a smart system for parallel migrations (round-robin, FIFO).
Performance limits with huge vCenter environments remain a concern.
Troubleshooting & Ops Integration
Validation errors should log to syslog.
Need in-UI timestamps to correlate with logs.
Planning & Capacity
Capacity & cost planning from the Ops Console should carry into the migration plan.
Prefer integration with the Ops Console and Net Ops for diagnostics & planning.
Users expect to start migration from the familiar inventory view.
High value redesigns, shipped end-to-end.
Global visibility at the landing page
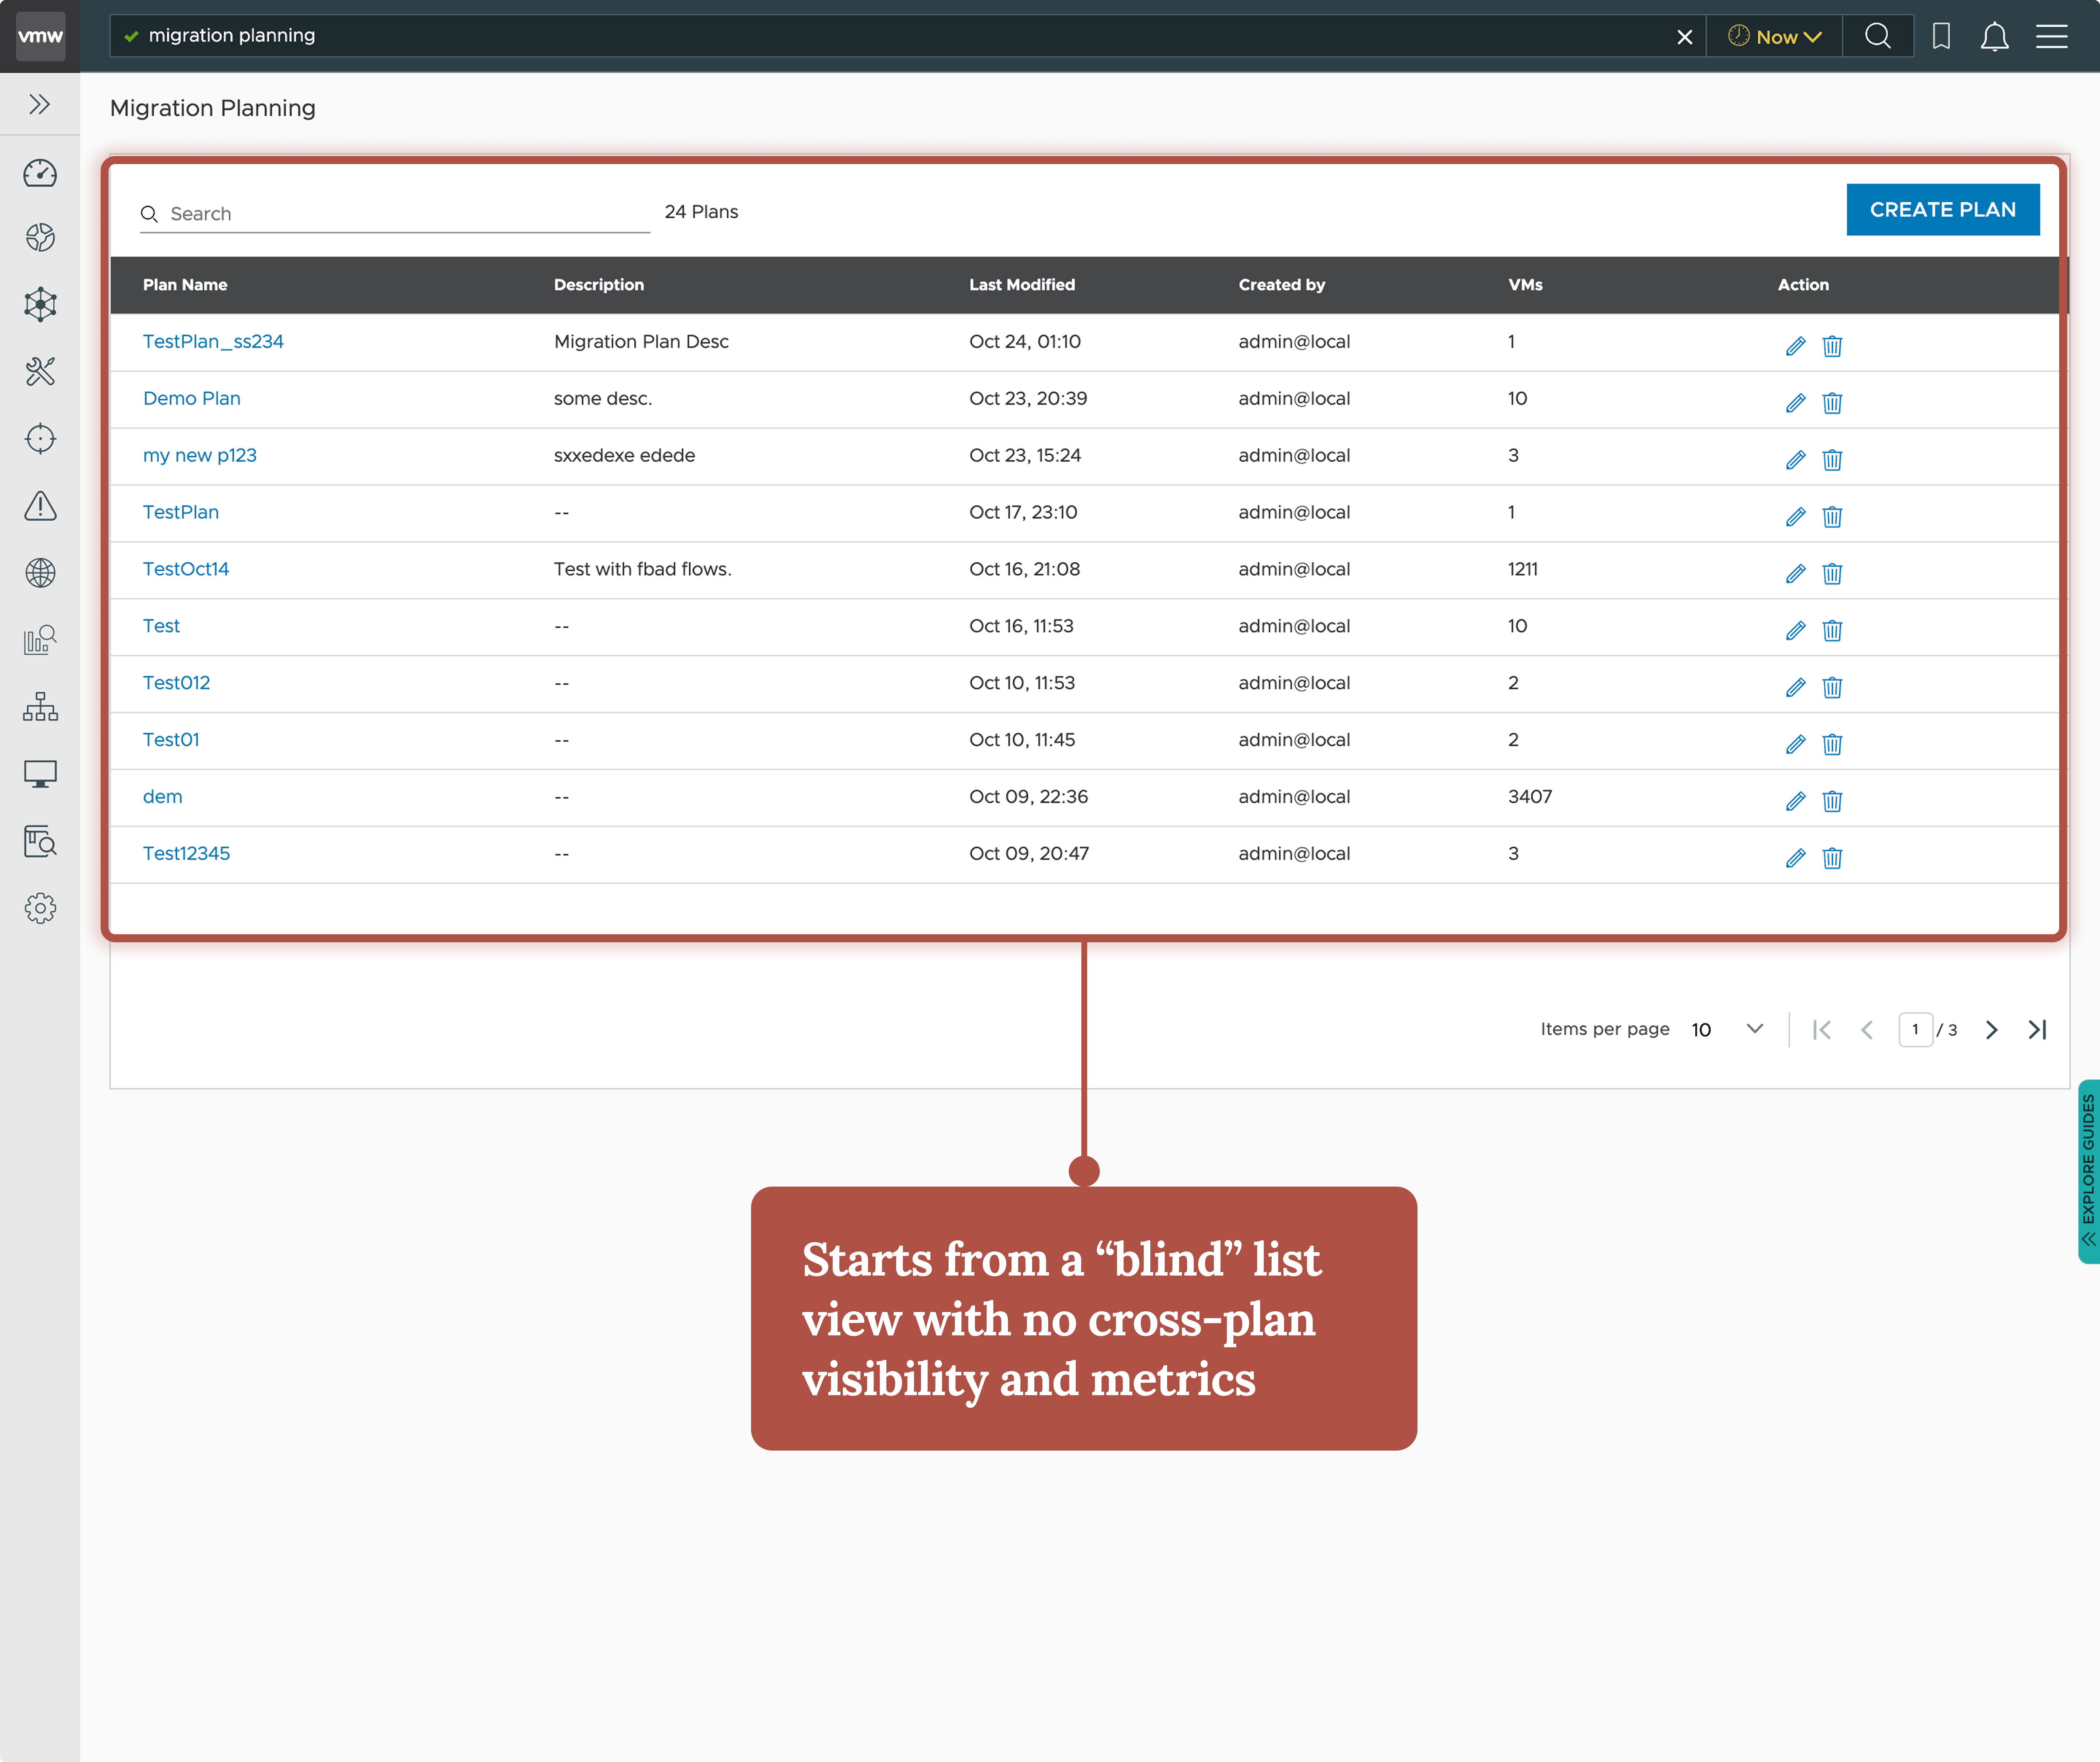
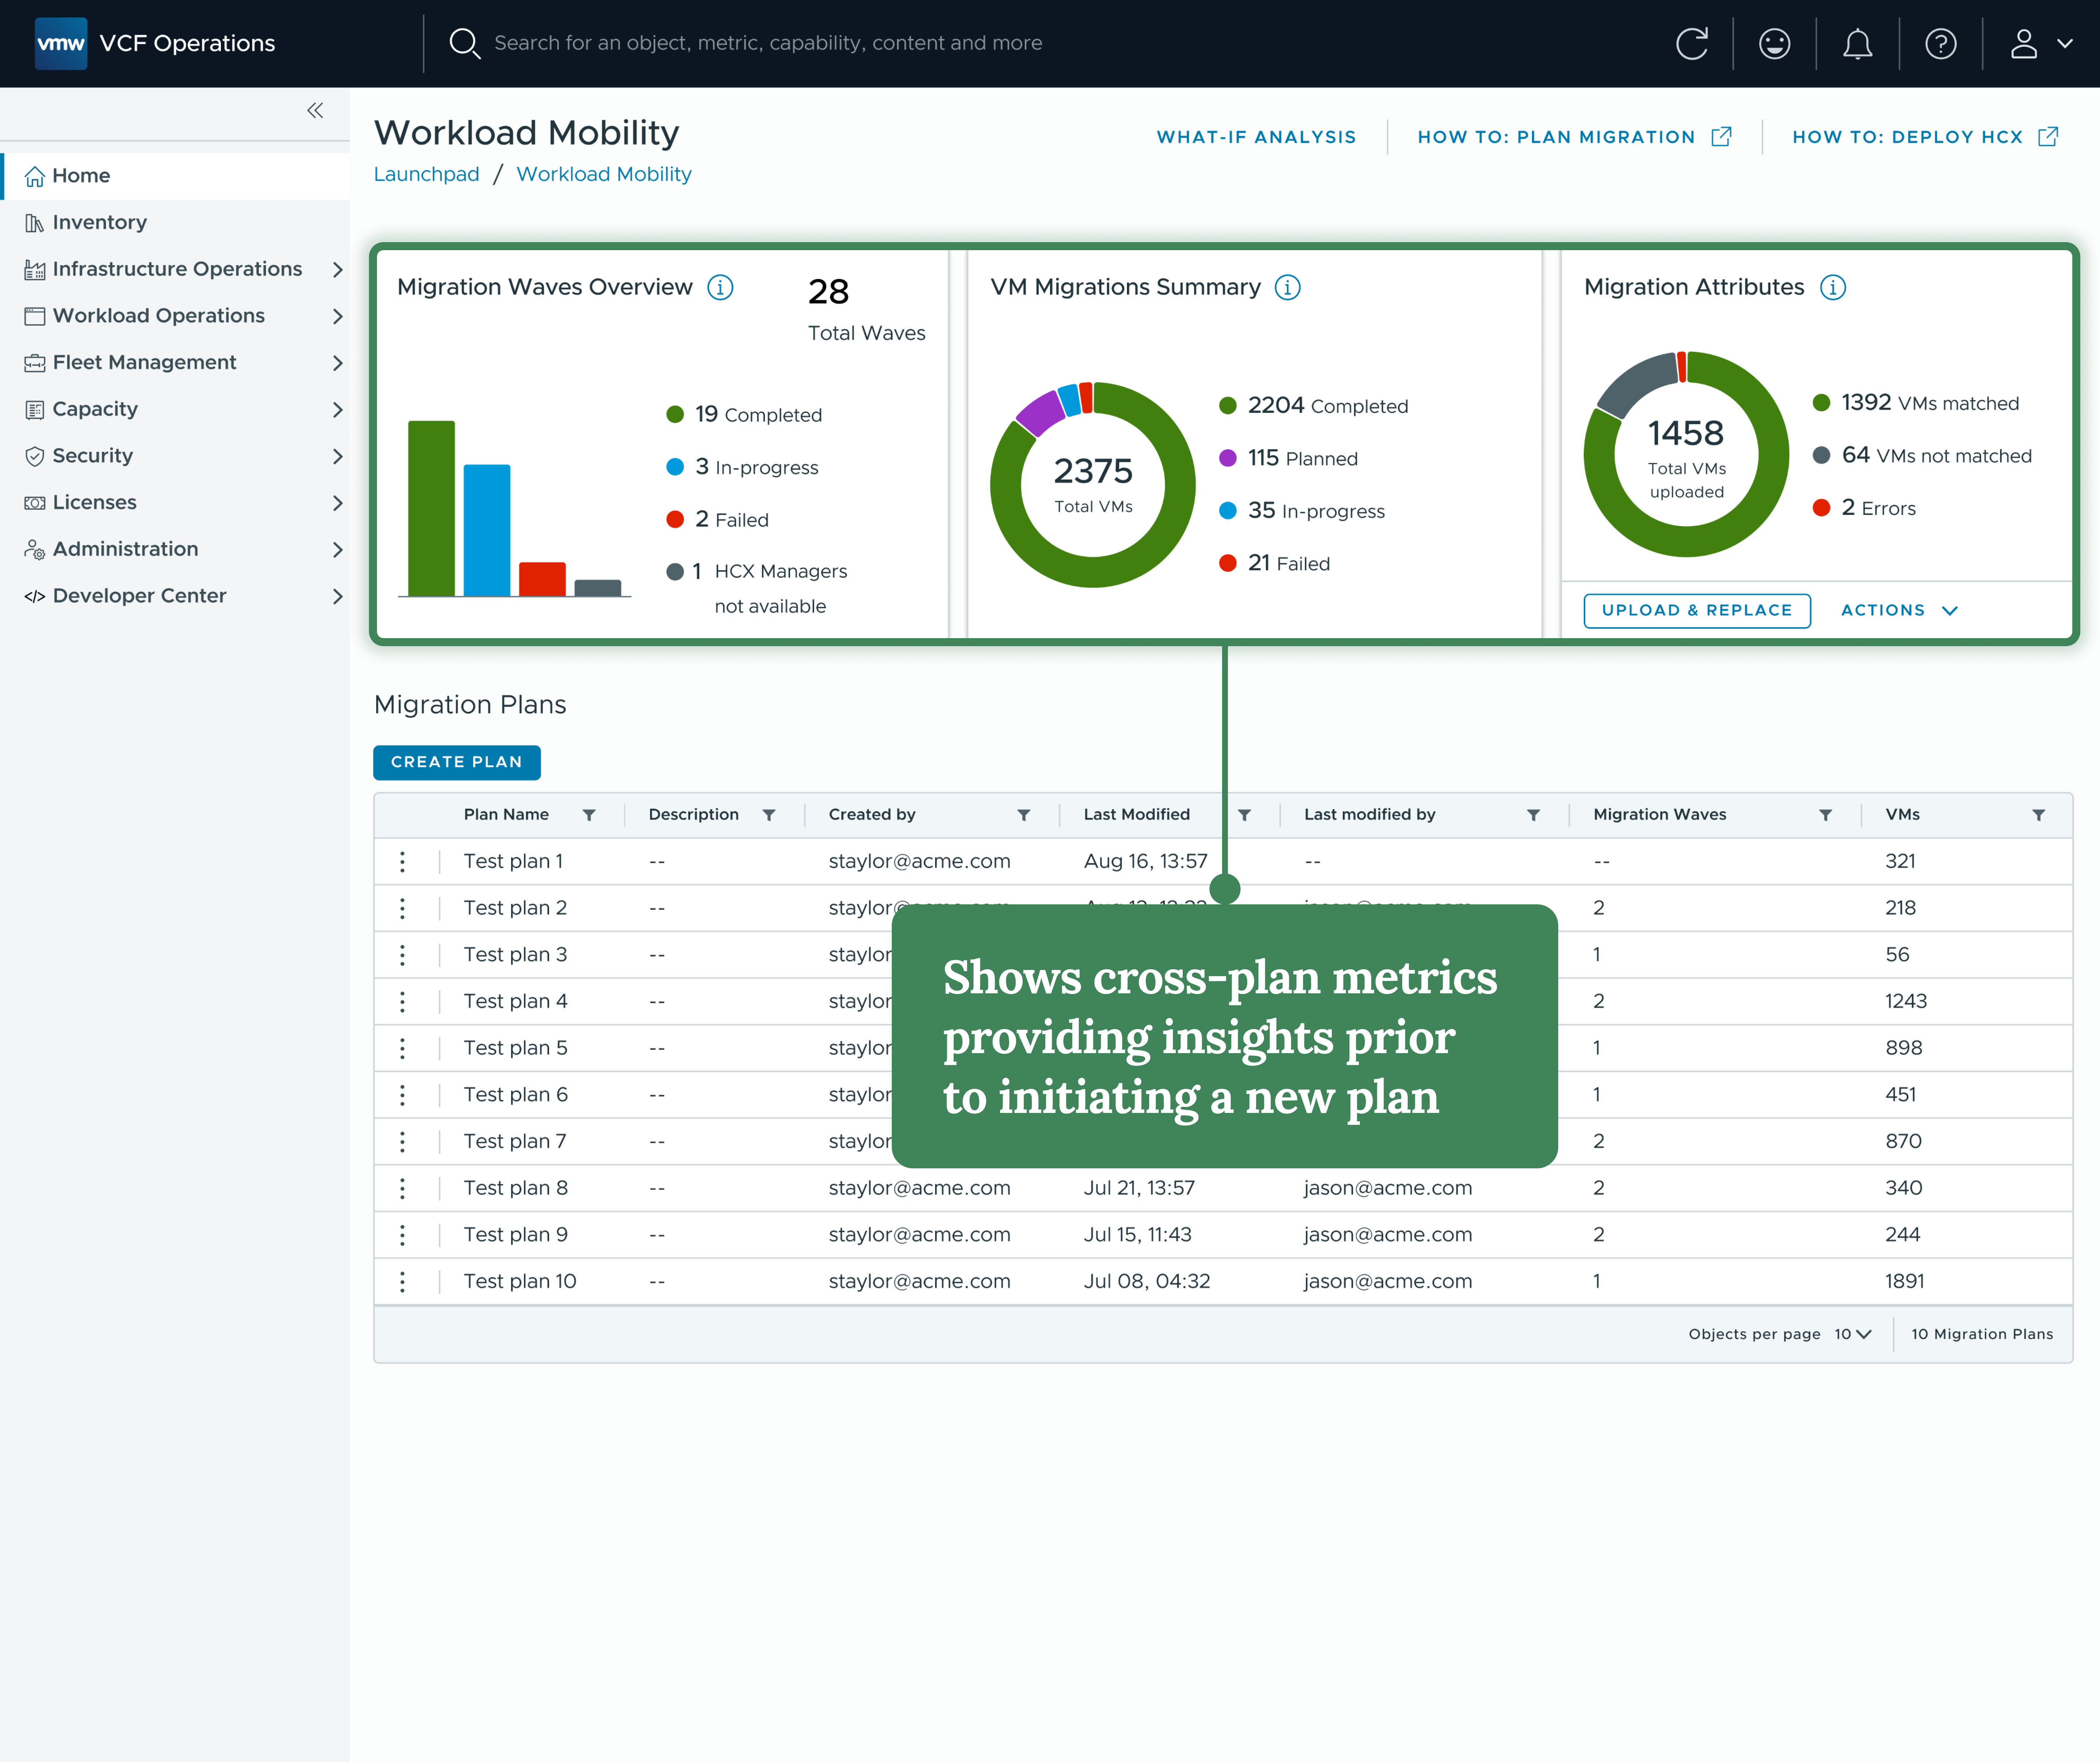
Contextualizing the global scope. The legacy planning tool forced users to start from a blind list view. I redesigned the landing experience into a data-rich dashboard, providing immediate cross-plan metrics — such as completed vs. failed waves — before the user even initiates a new migration plan.
Starting from the inventory
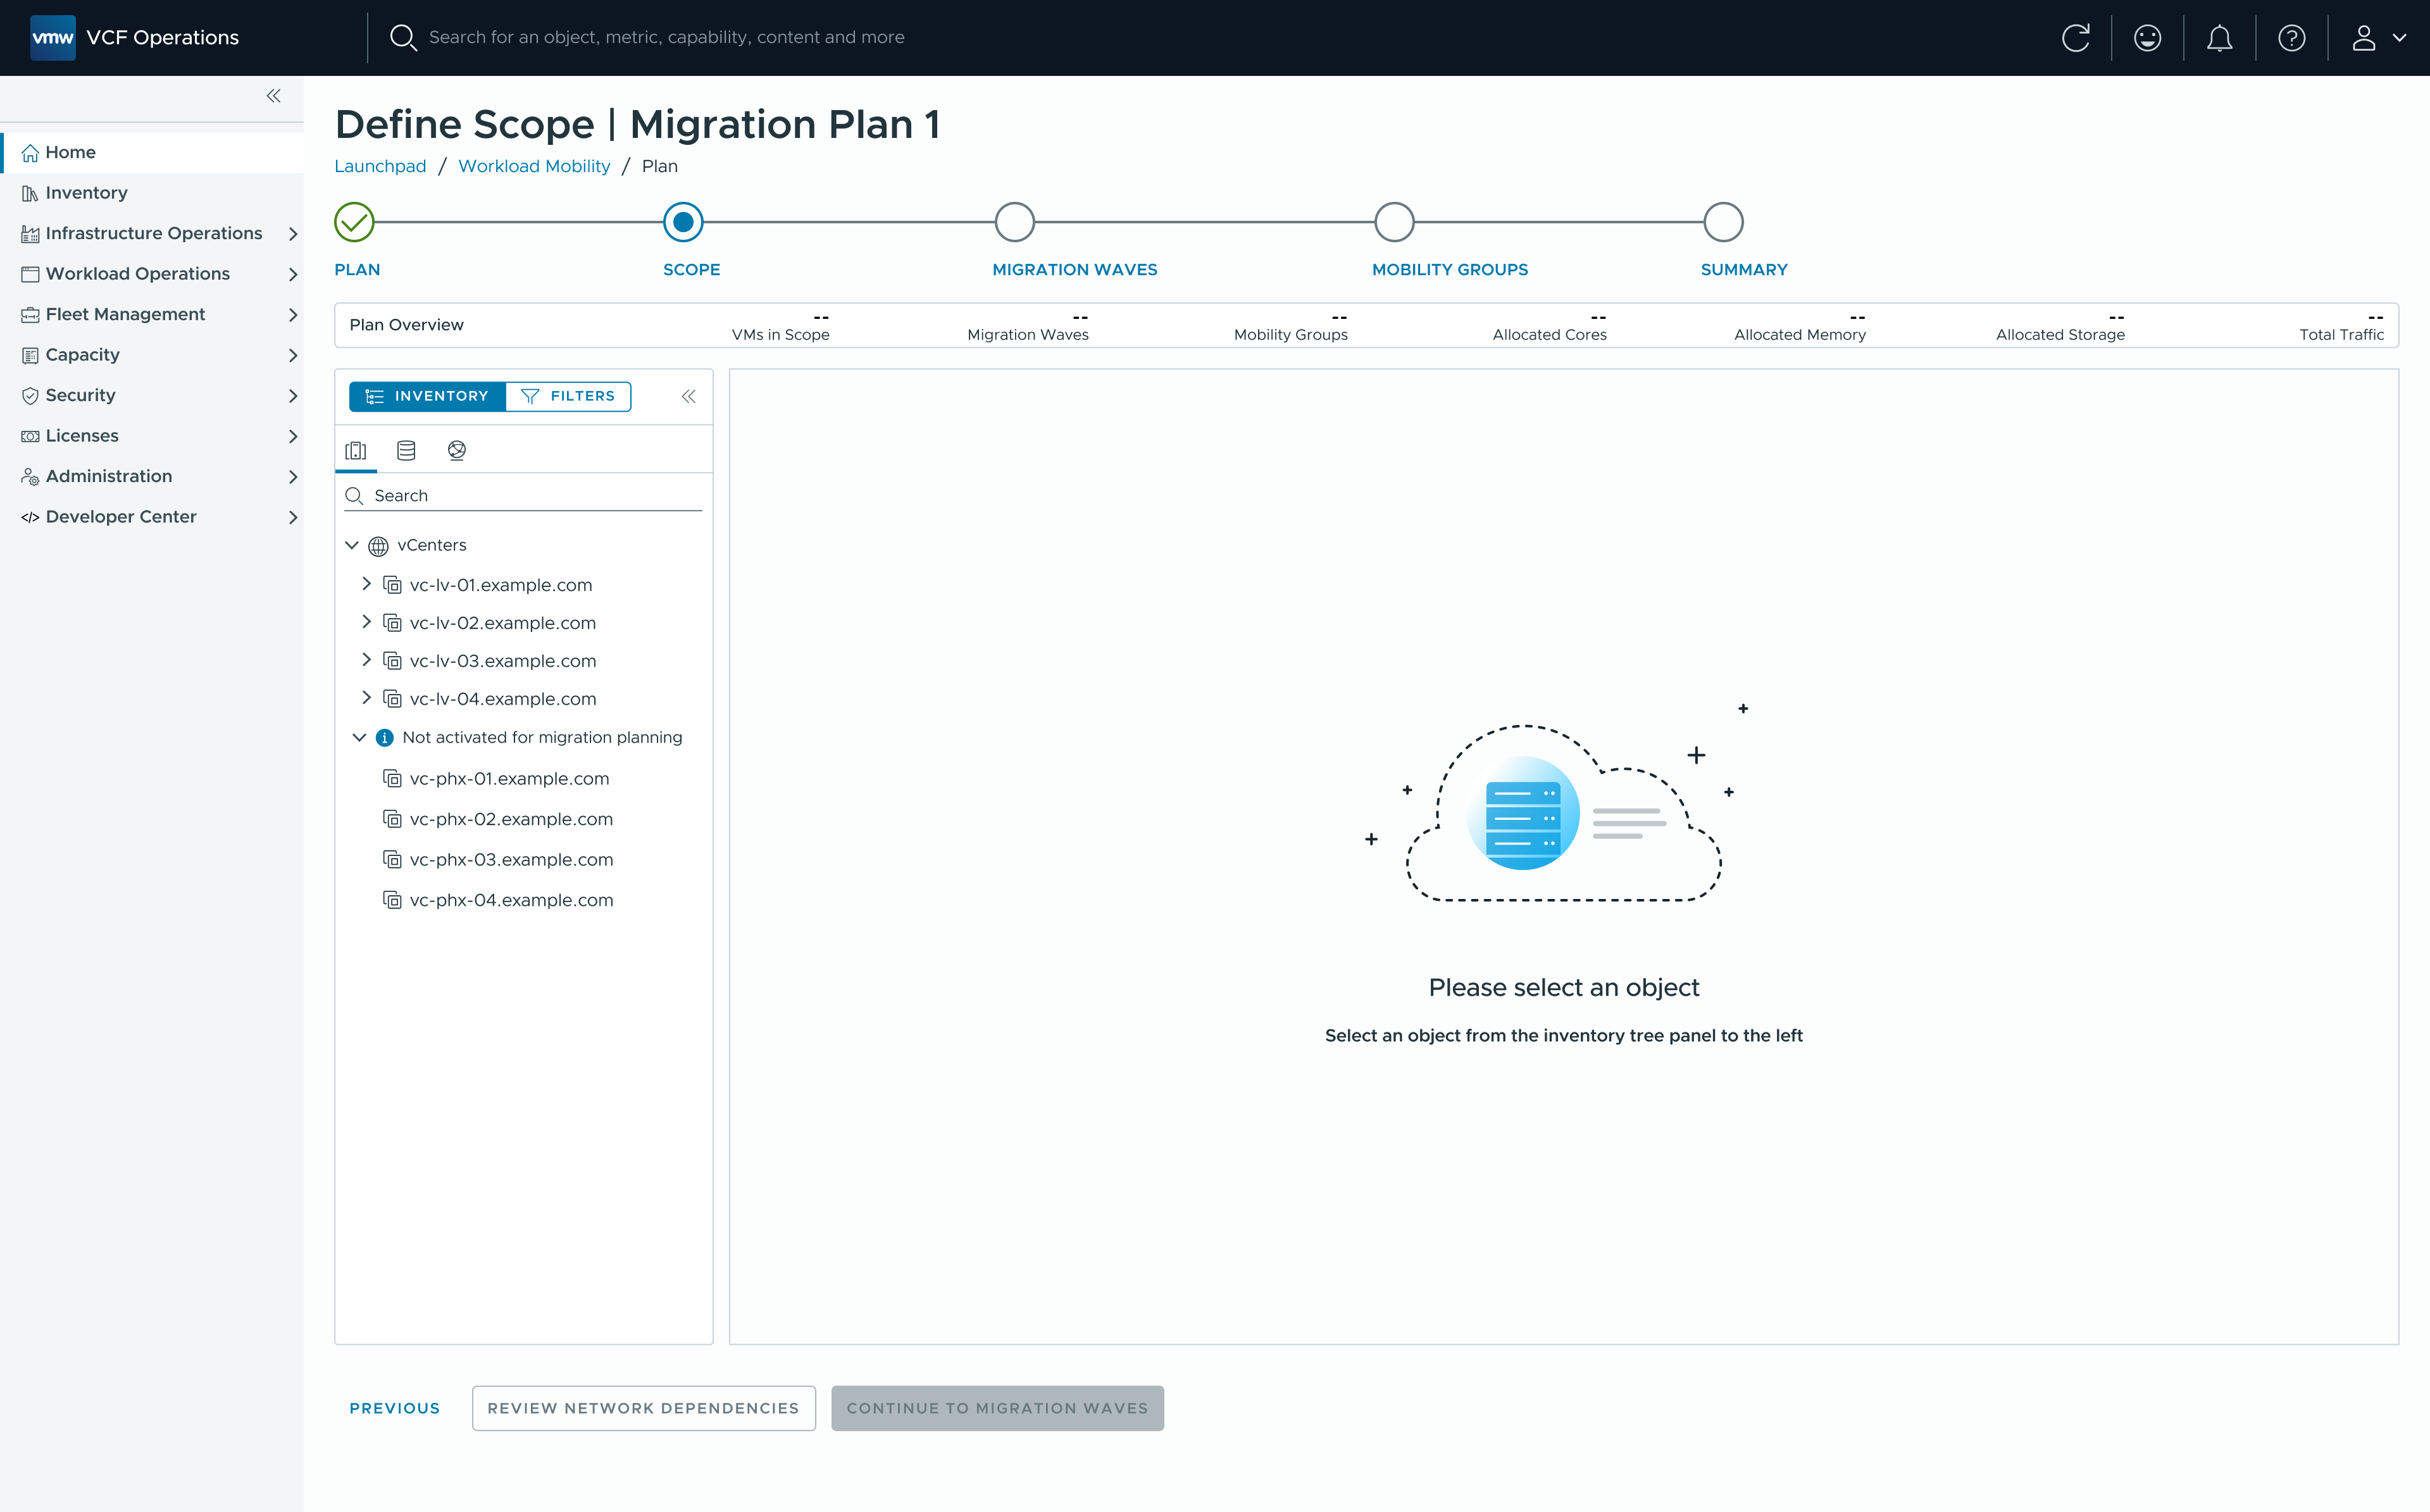
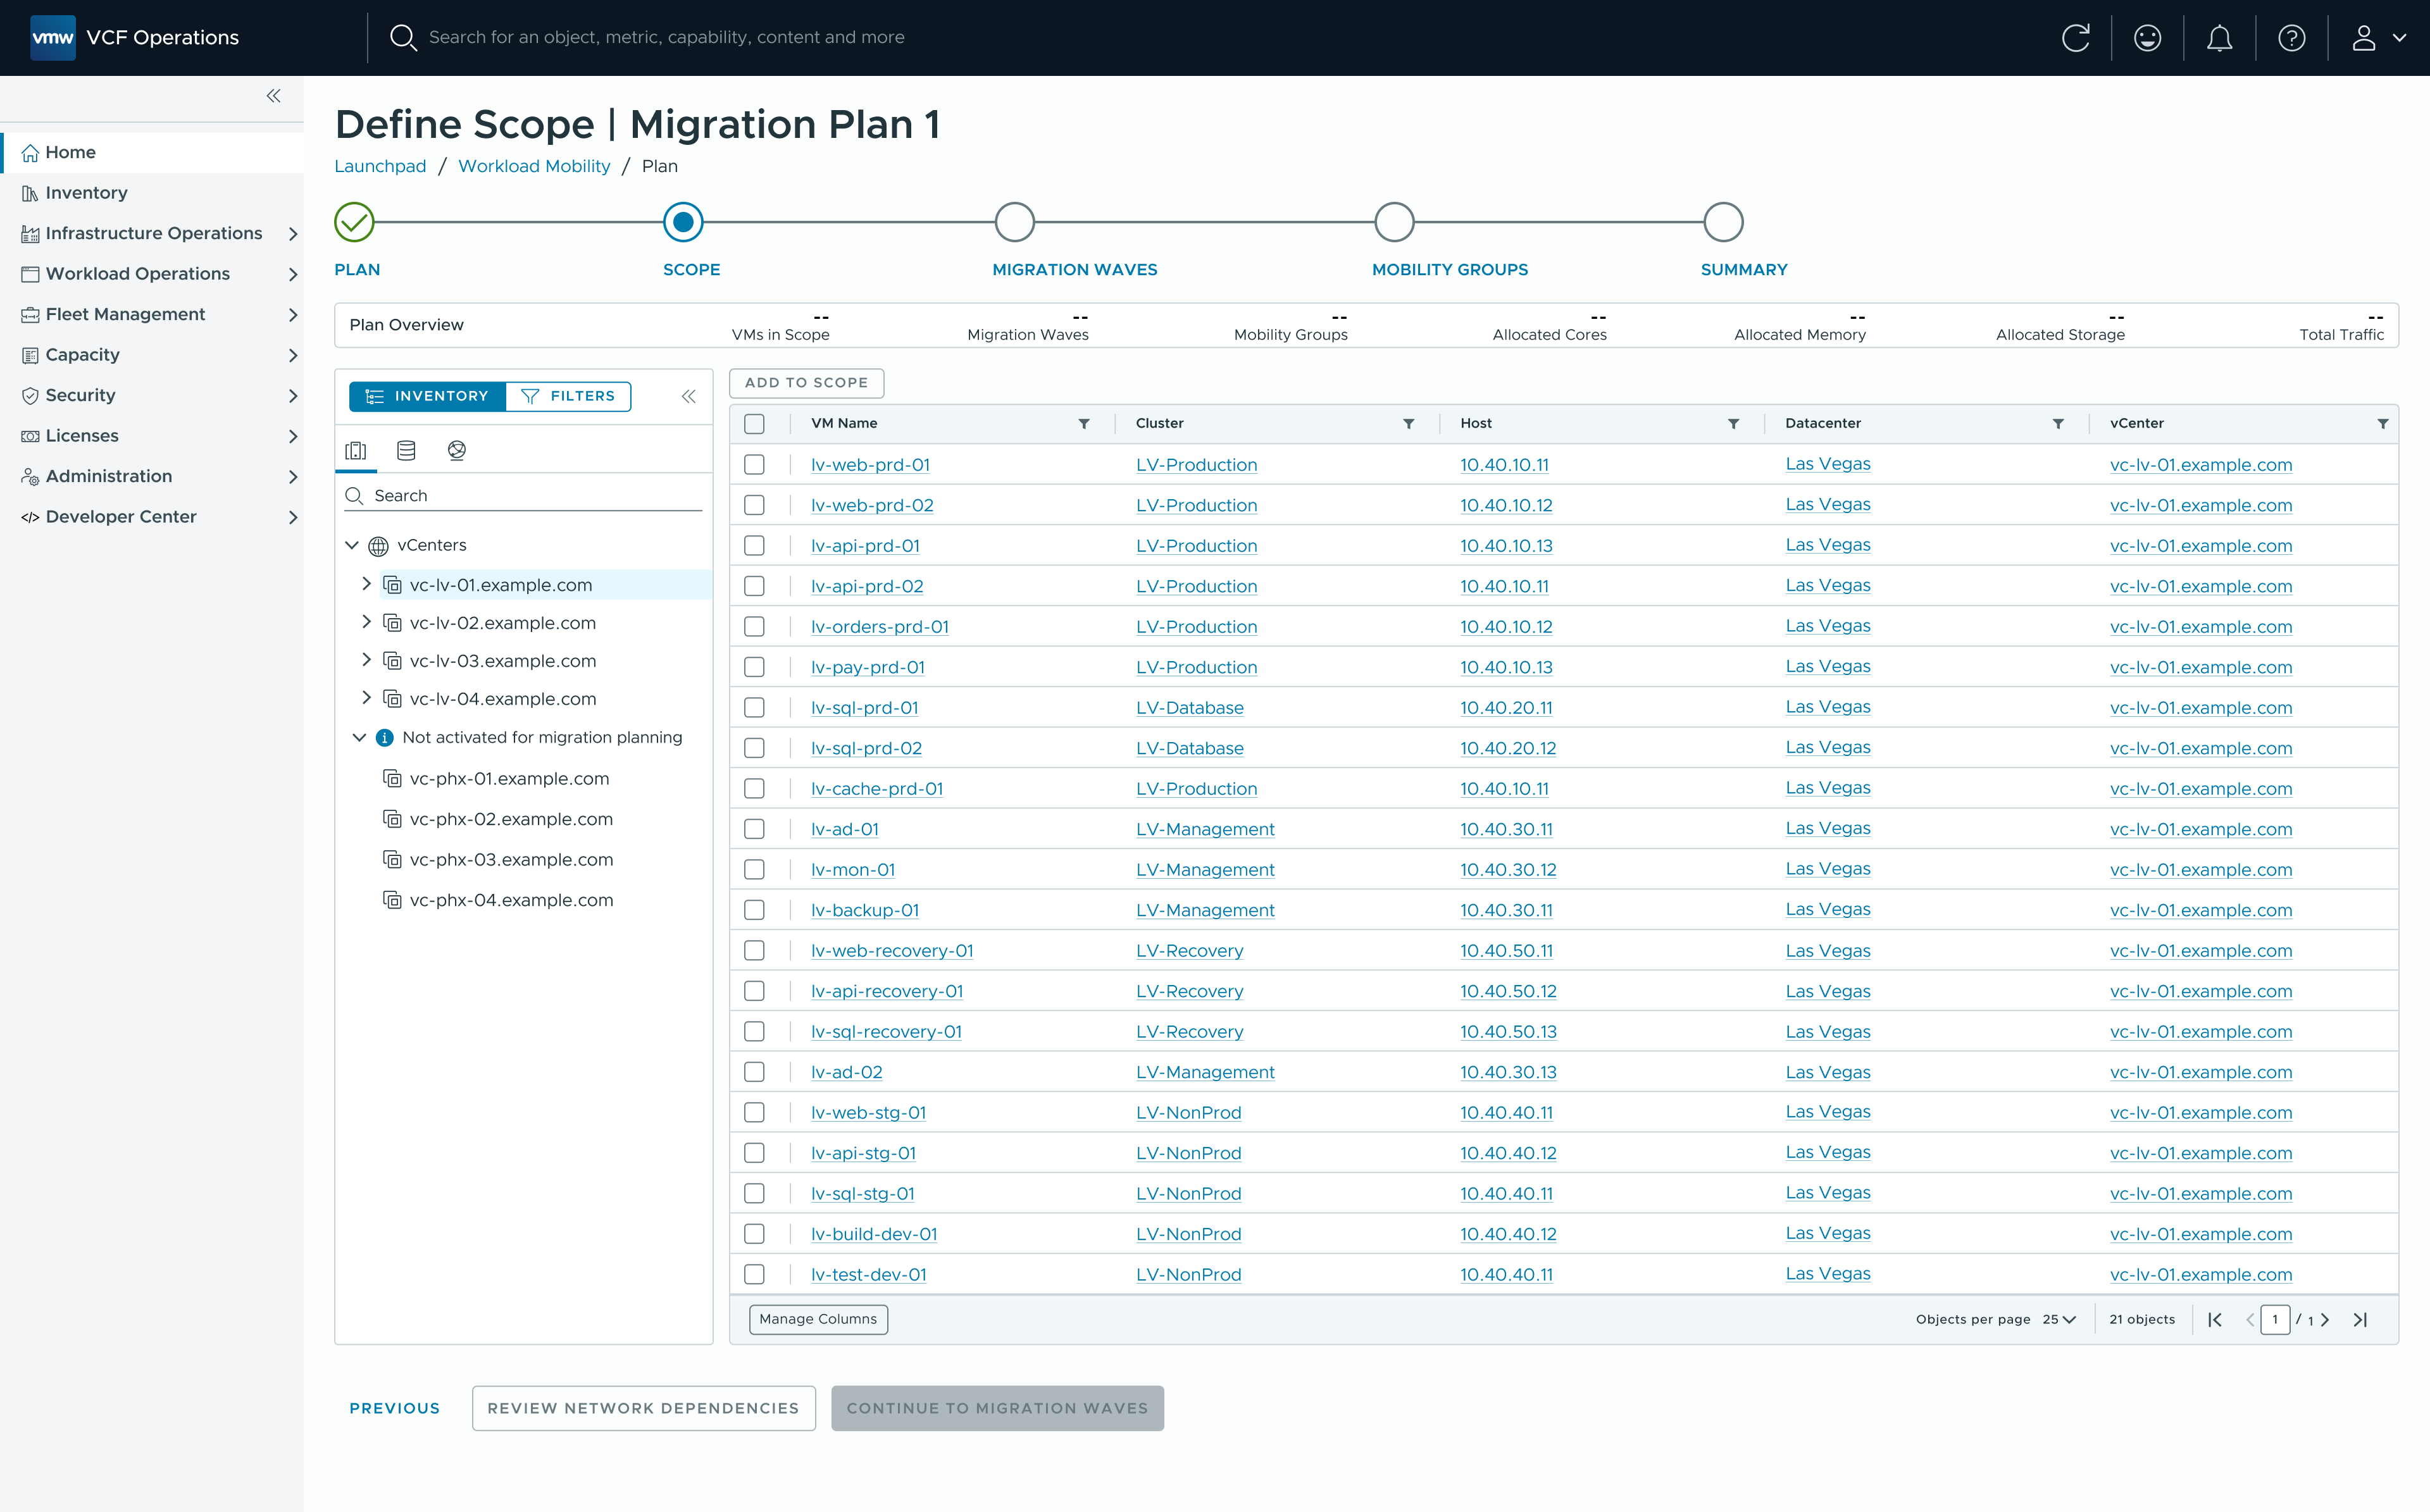
Scope by object, not by list. The legacy Net Ops UI listed every VM up front, and users told us that wasn't useful — a migration plan starts from a use case. Retiring an old datastore or network, for example, means moving every VM on that object. Research also showed operators expected to start from the familiar inventory view, so I built scoping around the Ops inventory tree: pick a cluster or host, a datastore, or a network, see only the VMs attached to it, and add them to the plan's scope.
Persistent context during plan creation
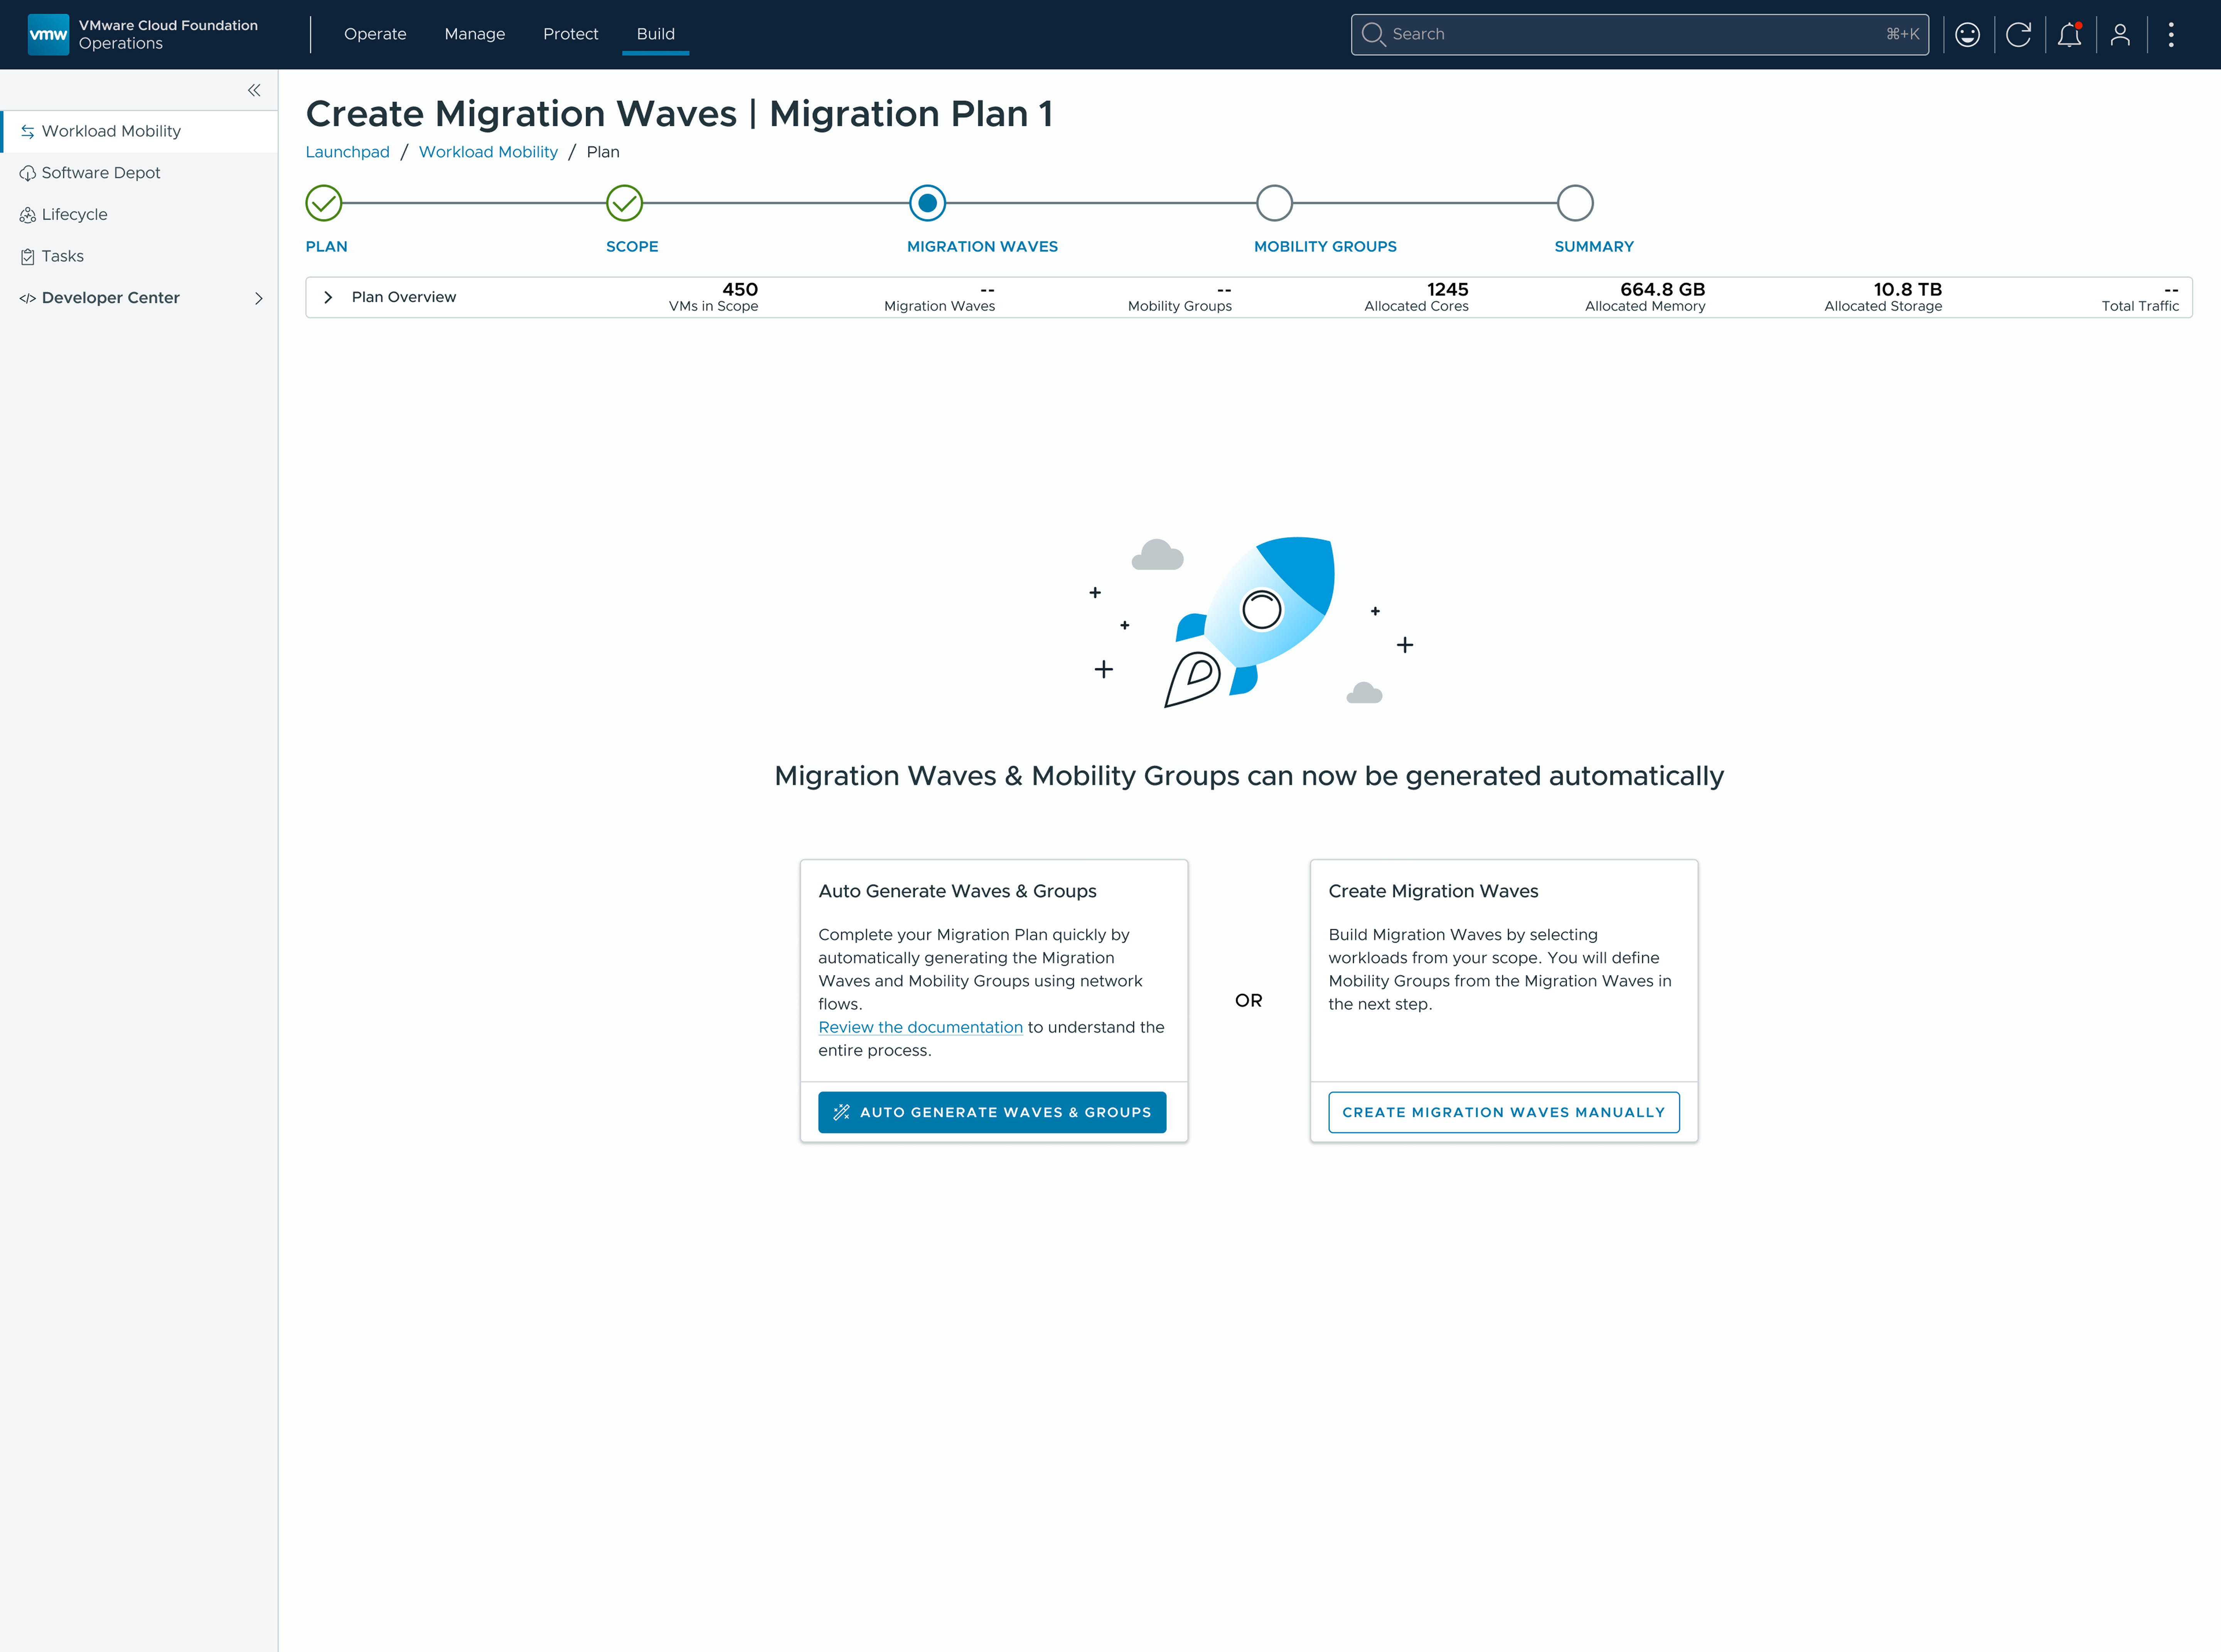
Persistent summary widget. During research, users reported limited visibility into the plan's capacity once they were deep inside the migration workflow. In direct response, I designed a sticky, collapsible summary widget that persists across every step of plan creation — ensuring operators always have real-time visibility into allocated resources without losing their place.
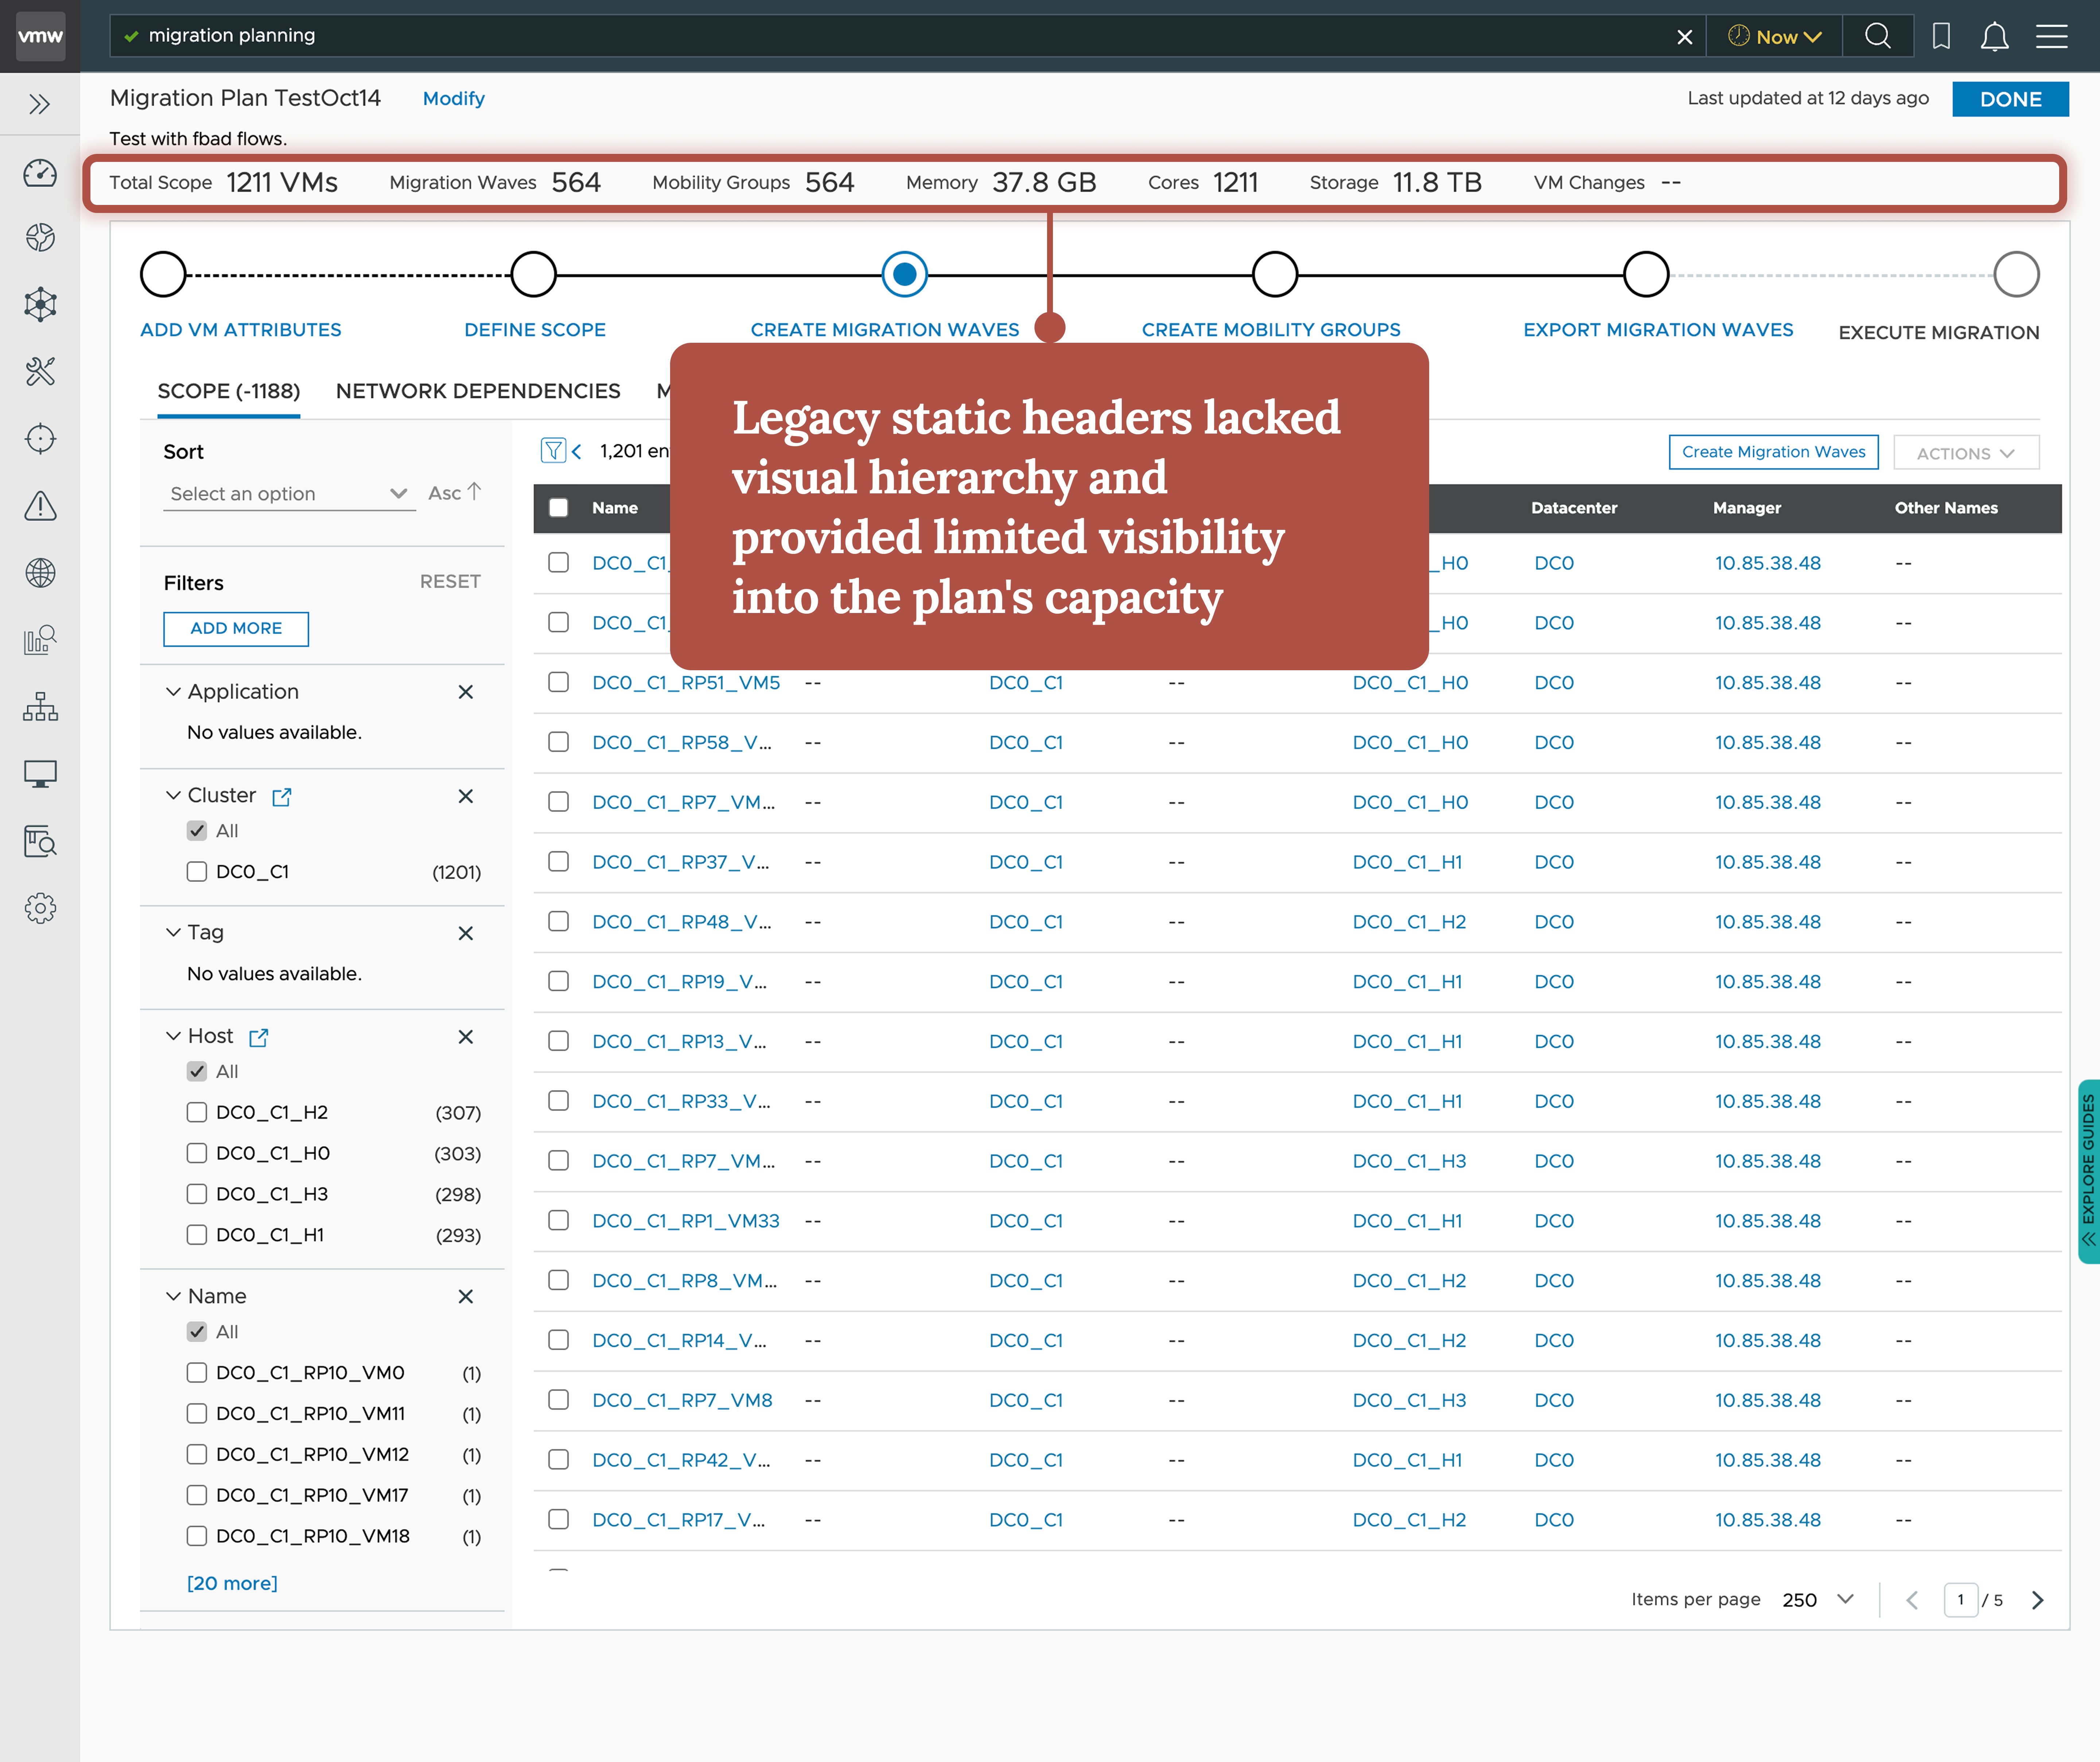
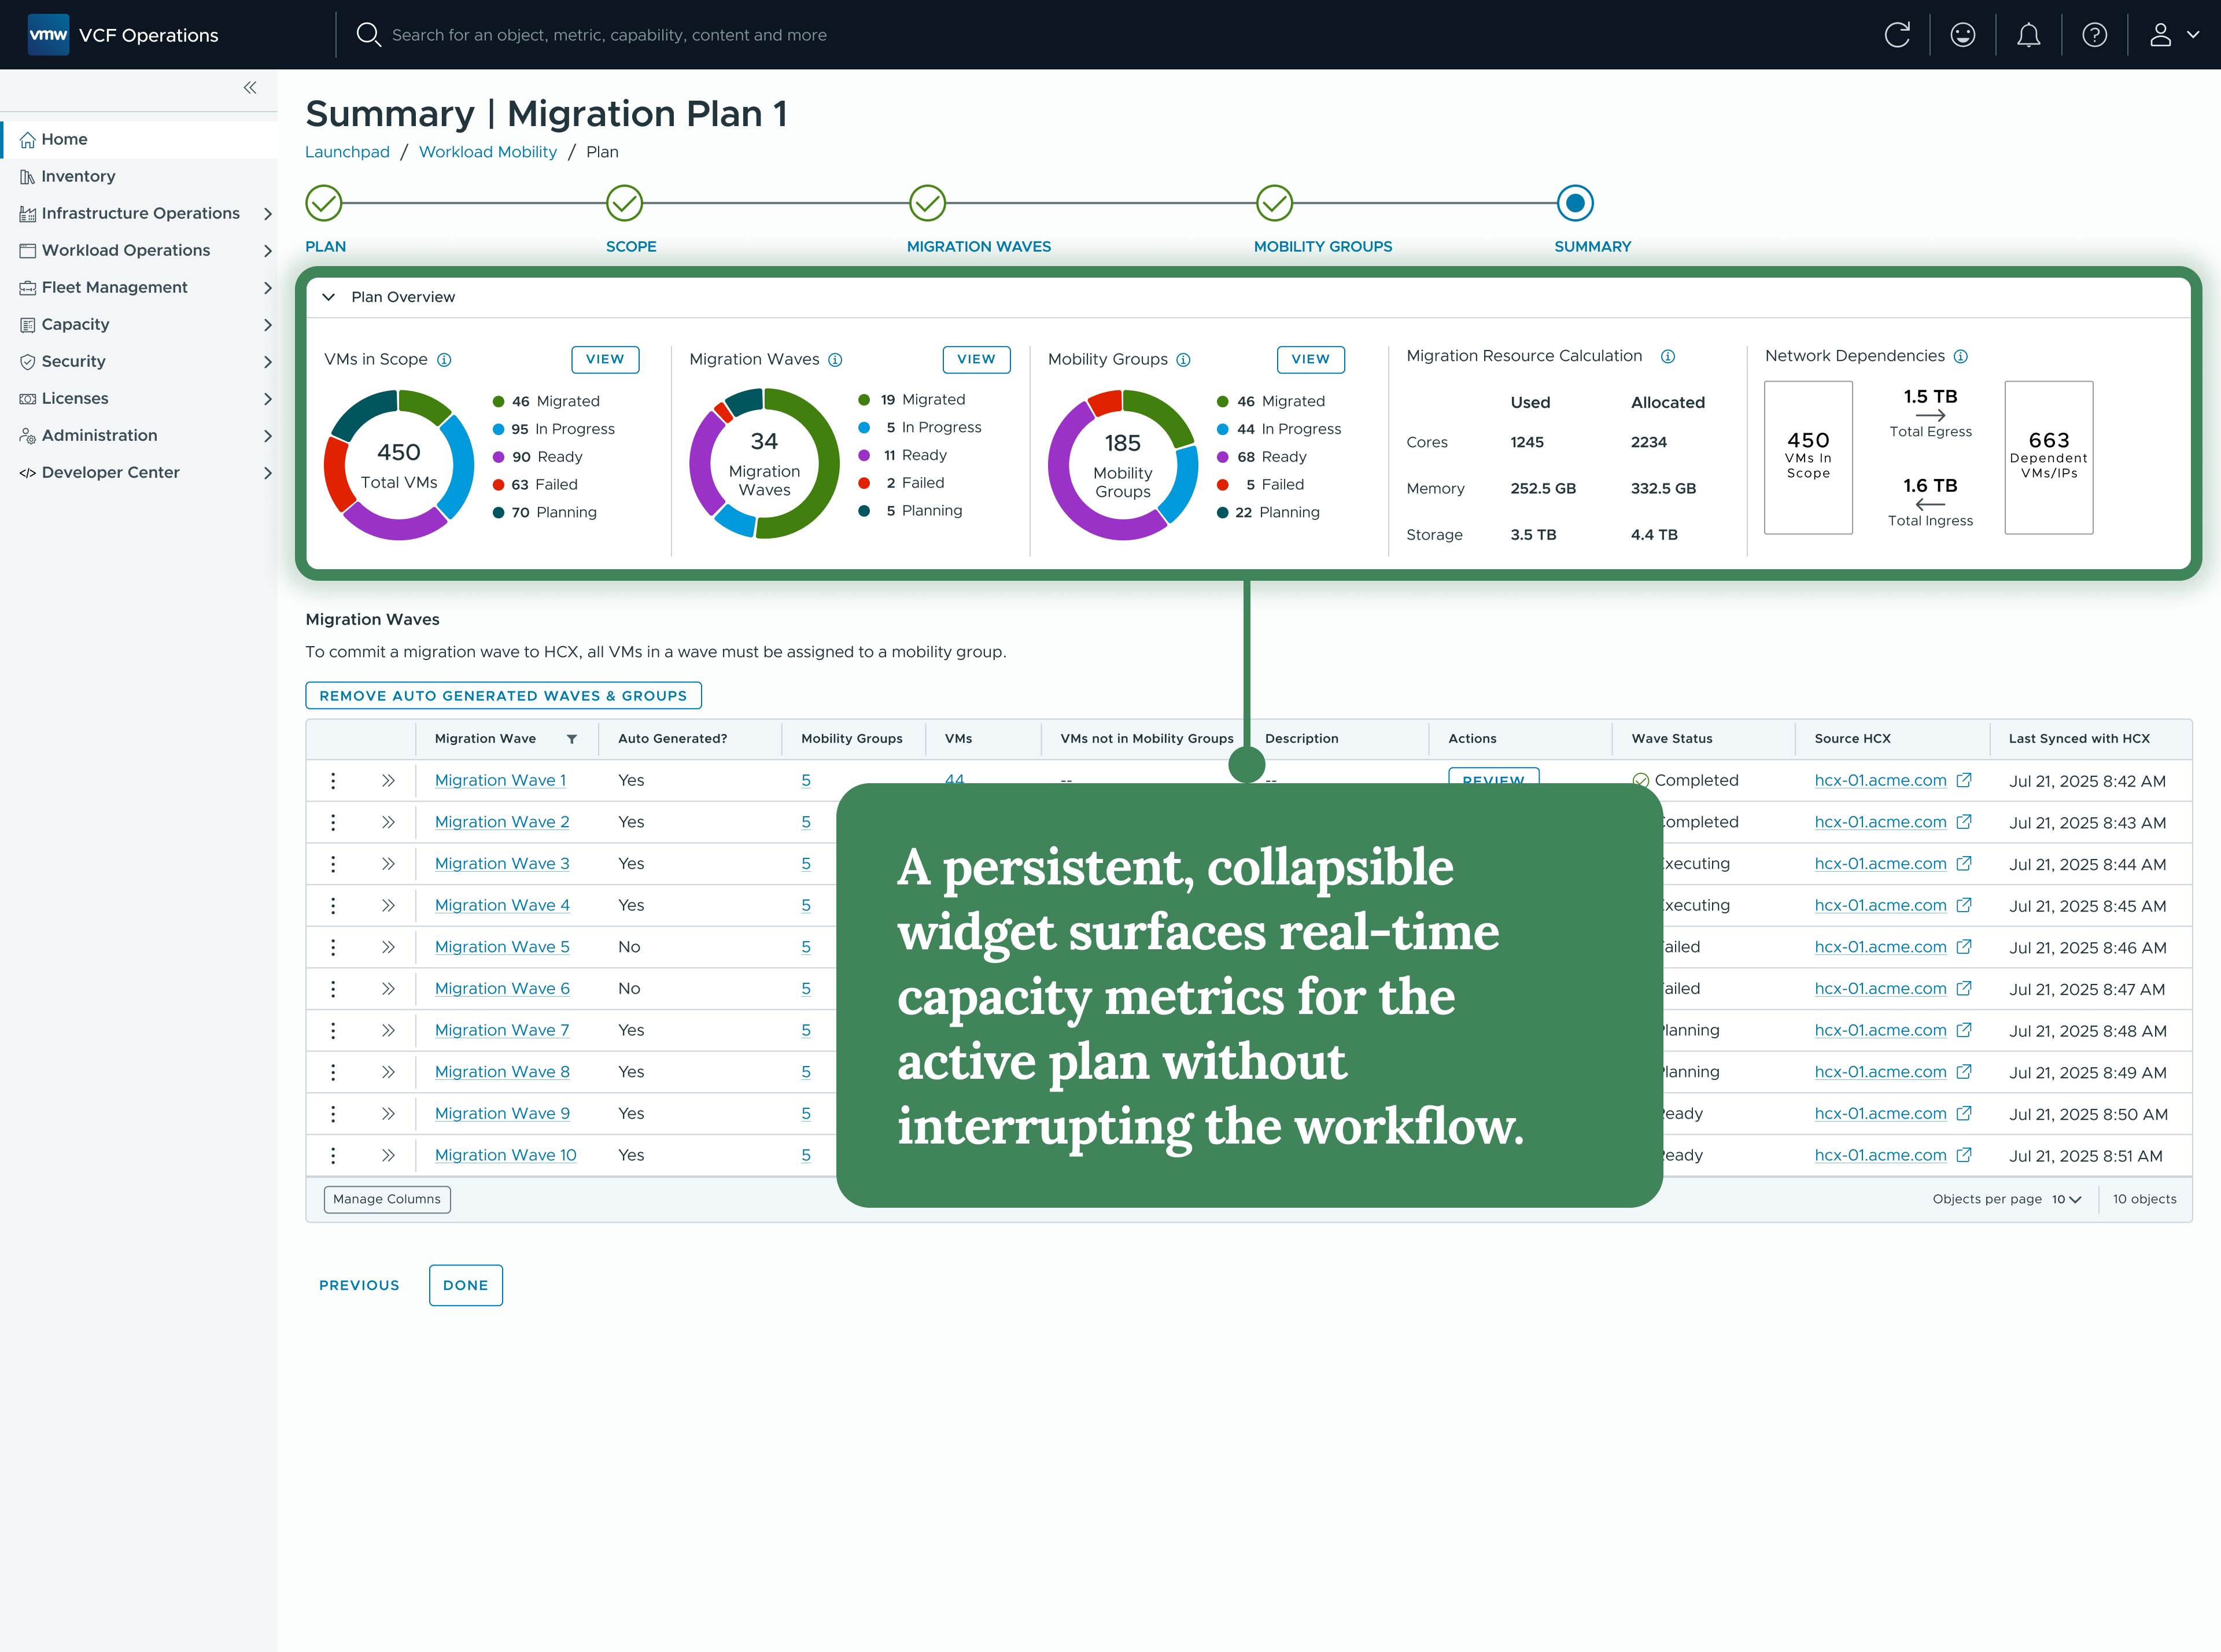
Where the widget lived was the open question. I explored four placements, weighing each on whether it held a fixed, predictable spot, kept the operator's full work area, and stayed readable without a click.
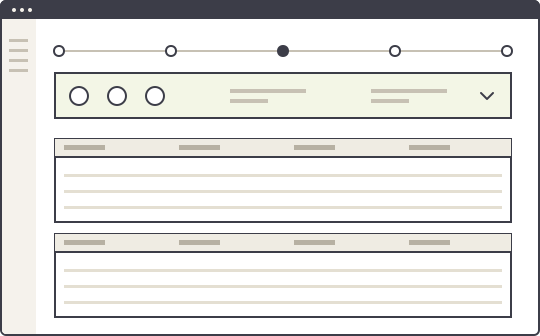
Fixed, predictable spot; collapses to a one-line strip, so the work area is only borrowed on demand.
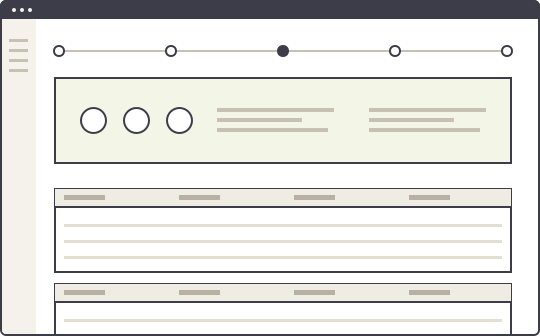
Always on — permanently pushes the work area down.
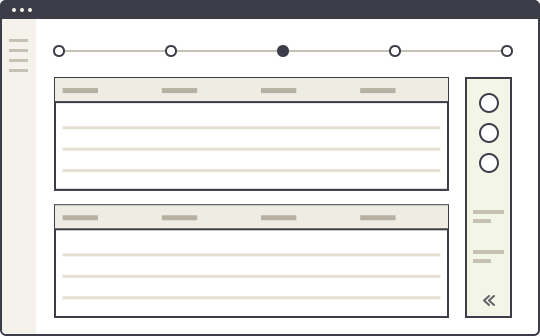
Competes with the wide VM tables for horizontal space.
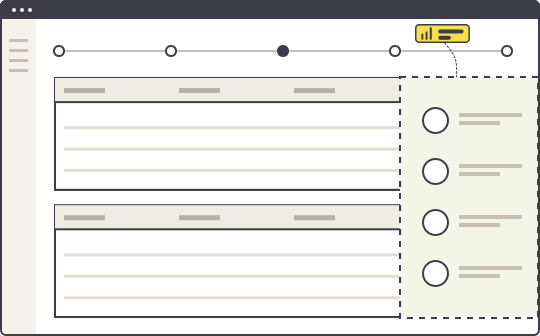
Hidden by default — needs to be clicked every time you need a number or a metric you're tracking continuously.
Automating the tedious and error-prone
Building migration waves by hand was tedious and error-prone. We introduced an option that analyzes network dependencies to generate migration waves and mobility groups automatically, giving operators a starting point instead of a blank plan. Once generation completes, operators can review the result and override it. Manual grouping stayed available: research later showed operators wouldn't rely on generated waves until the logic weighed more than network dependencies.
Modernizing legacy execution workflows
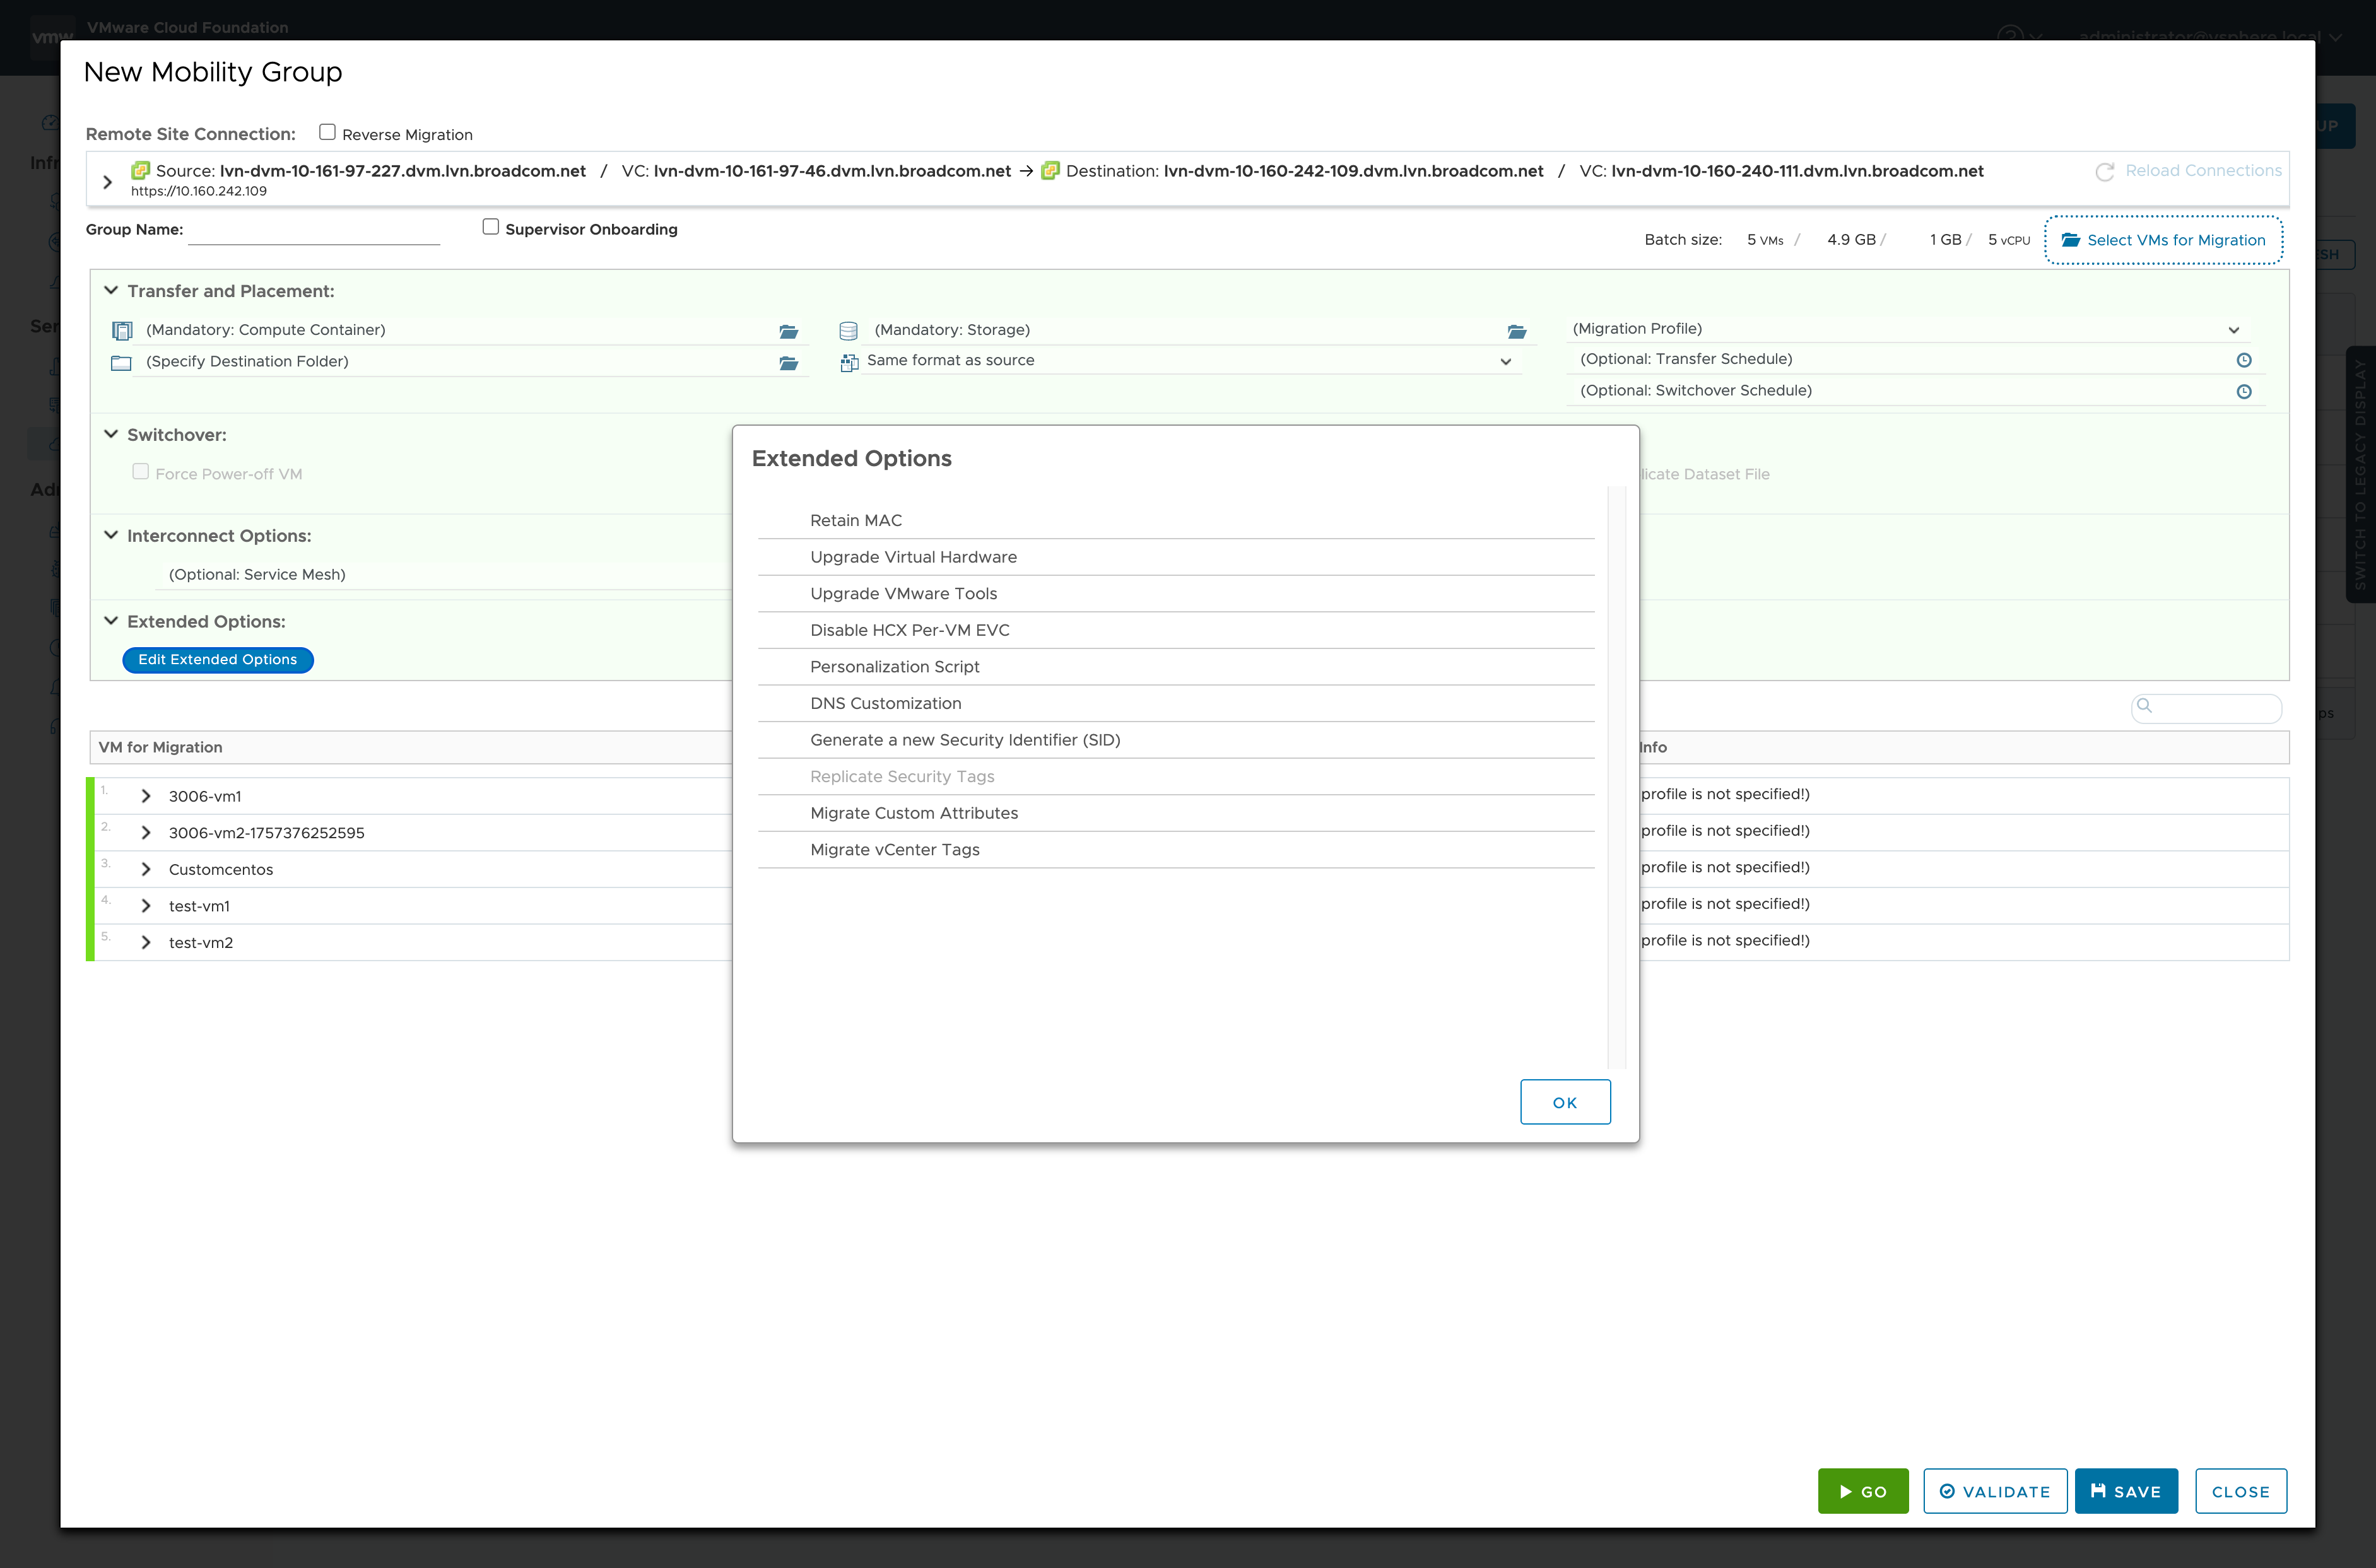
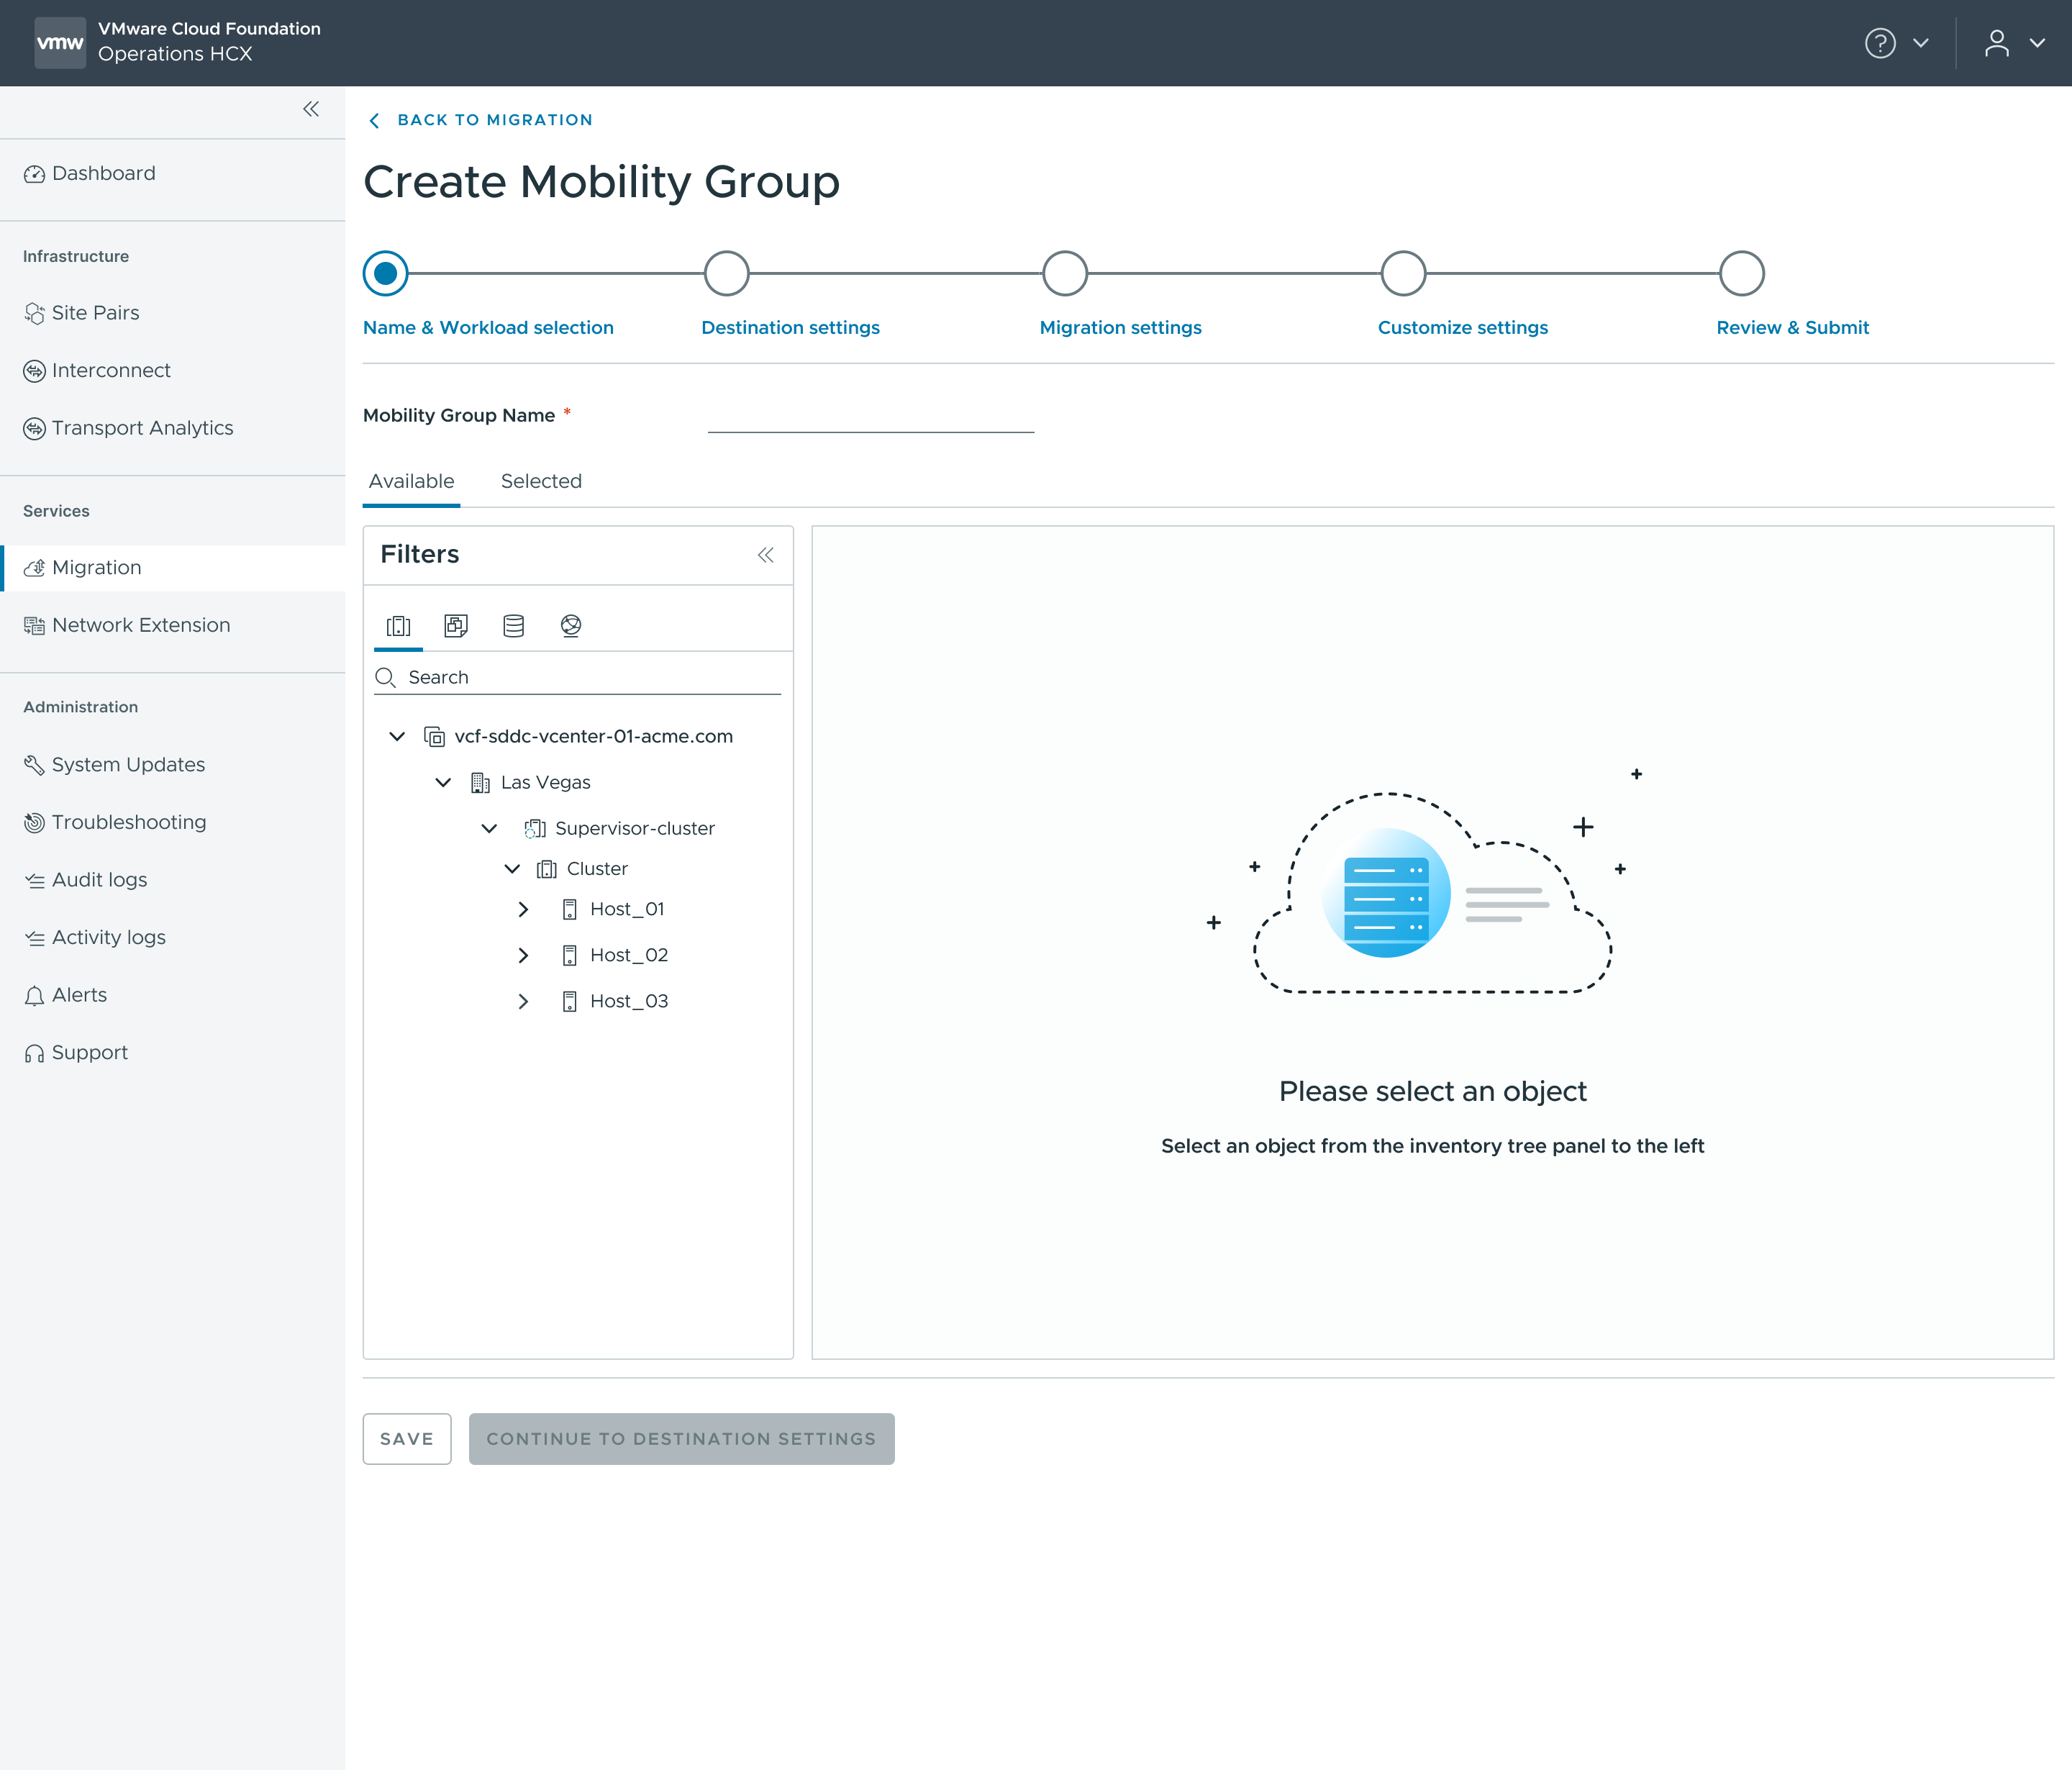
HCX's legacy execution flow buried critical settings under complex, nested interactions. Within the same workstream, product needed to move HCX off its legacy tech stack — and I used the rebuild to fix interactions customers had complained about for years. I redesigned the flow into a clear, linear progression, with scalable inventory tables and network destinations assigned globally instead of VM by VM. It shipped alongside the planning redesign, structured for a later move into the Ops Console.
In the operator's own words.
From research sessions with enterprise customers during the redesign — including where they wanted the work to go further.
I'm encouraged by the direction Migration is taking. Greater integration between HCX and Net Ops would help create a more cohesive and streamlined workflow.
Fortune 500 bank
Auto-generating waves and groups could be highly beneficial for us. I'd like to see the logic incorporate additional criteria beyond just network dependencies.
National health system
I would like the planning capability to be built into Ops without having to install Net Ops. I'd especially like to use that collapsible widget to understand capacity needs from an HCX service-mesh standpoint.
Fortune 500 payments company
What changed after Phase 1 shipped.
Phase 1 shipped in June 2025. These results reflect the whole team's work — including backend improvements across Net Ops and HCX — not design alone.
Faster migrations
A major bank completed a datacenter migration of ~80,000 VMs in 25 days; a similar migration had previously taken three months. Design changes that contributed: a single Commit in place of per-wave export and import, a persistent widget that kept capacity in view, and starting migrations from the familiar inventory view. Plan data was available in both the UI and the API.
Reported by the product manager.
Fewer support cases
Two ticket types map directly to the redesign: CSV formatting errors, which dropped once waves no longer had to move between tools as exported files (outside the manual fallback); and HCX Manager connection errors, which admins now see on the landing dashboard early in planning.
Migration support tickets, Feb–Apr vs. Aug–Oct 2025.
Higher satisfaction
The annual CX survey rates migration as its own category. The legacy flow scored 65% in 2024; the redesigned flow scored 92% in 2025.
~250 responses in the 2025 survey.
From two tools to one global service.
After Phase 1 shipped, engineering proposed a new backend architecture: consolidating Net Ops and HCX into a single Global Mobility Service inside the Ops Console. The PM brought UX in to define what that would mean for operators, and I worked closely with the PM and the engineering architect on the vision, using research from the redesign as the baseline.
Global meant visibility into every vCenter the Ops Console can see — not just those registered in Net Ops — and, in time, migrations across sites, to other Ops instances or standalone vCenters. Service meant migration would be one capability of the Ops Console, not a separate tool.
Spring 2026 · Early concepts, not yet user-tested. I designed all four; they went into the PM's roadmap proposal for an executive review.
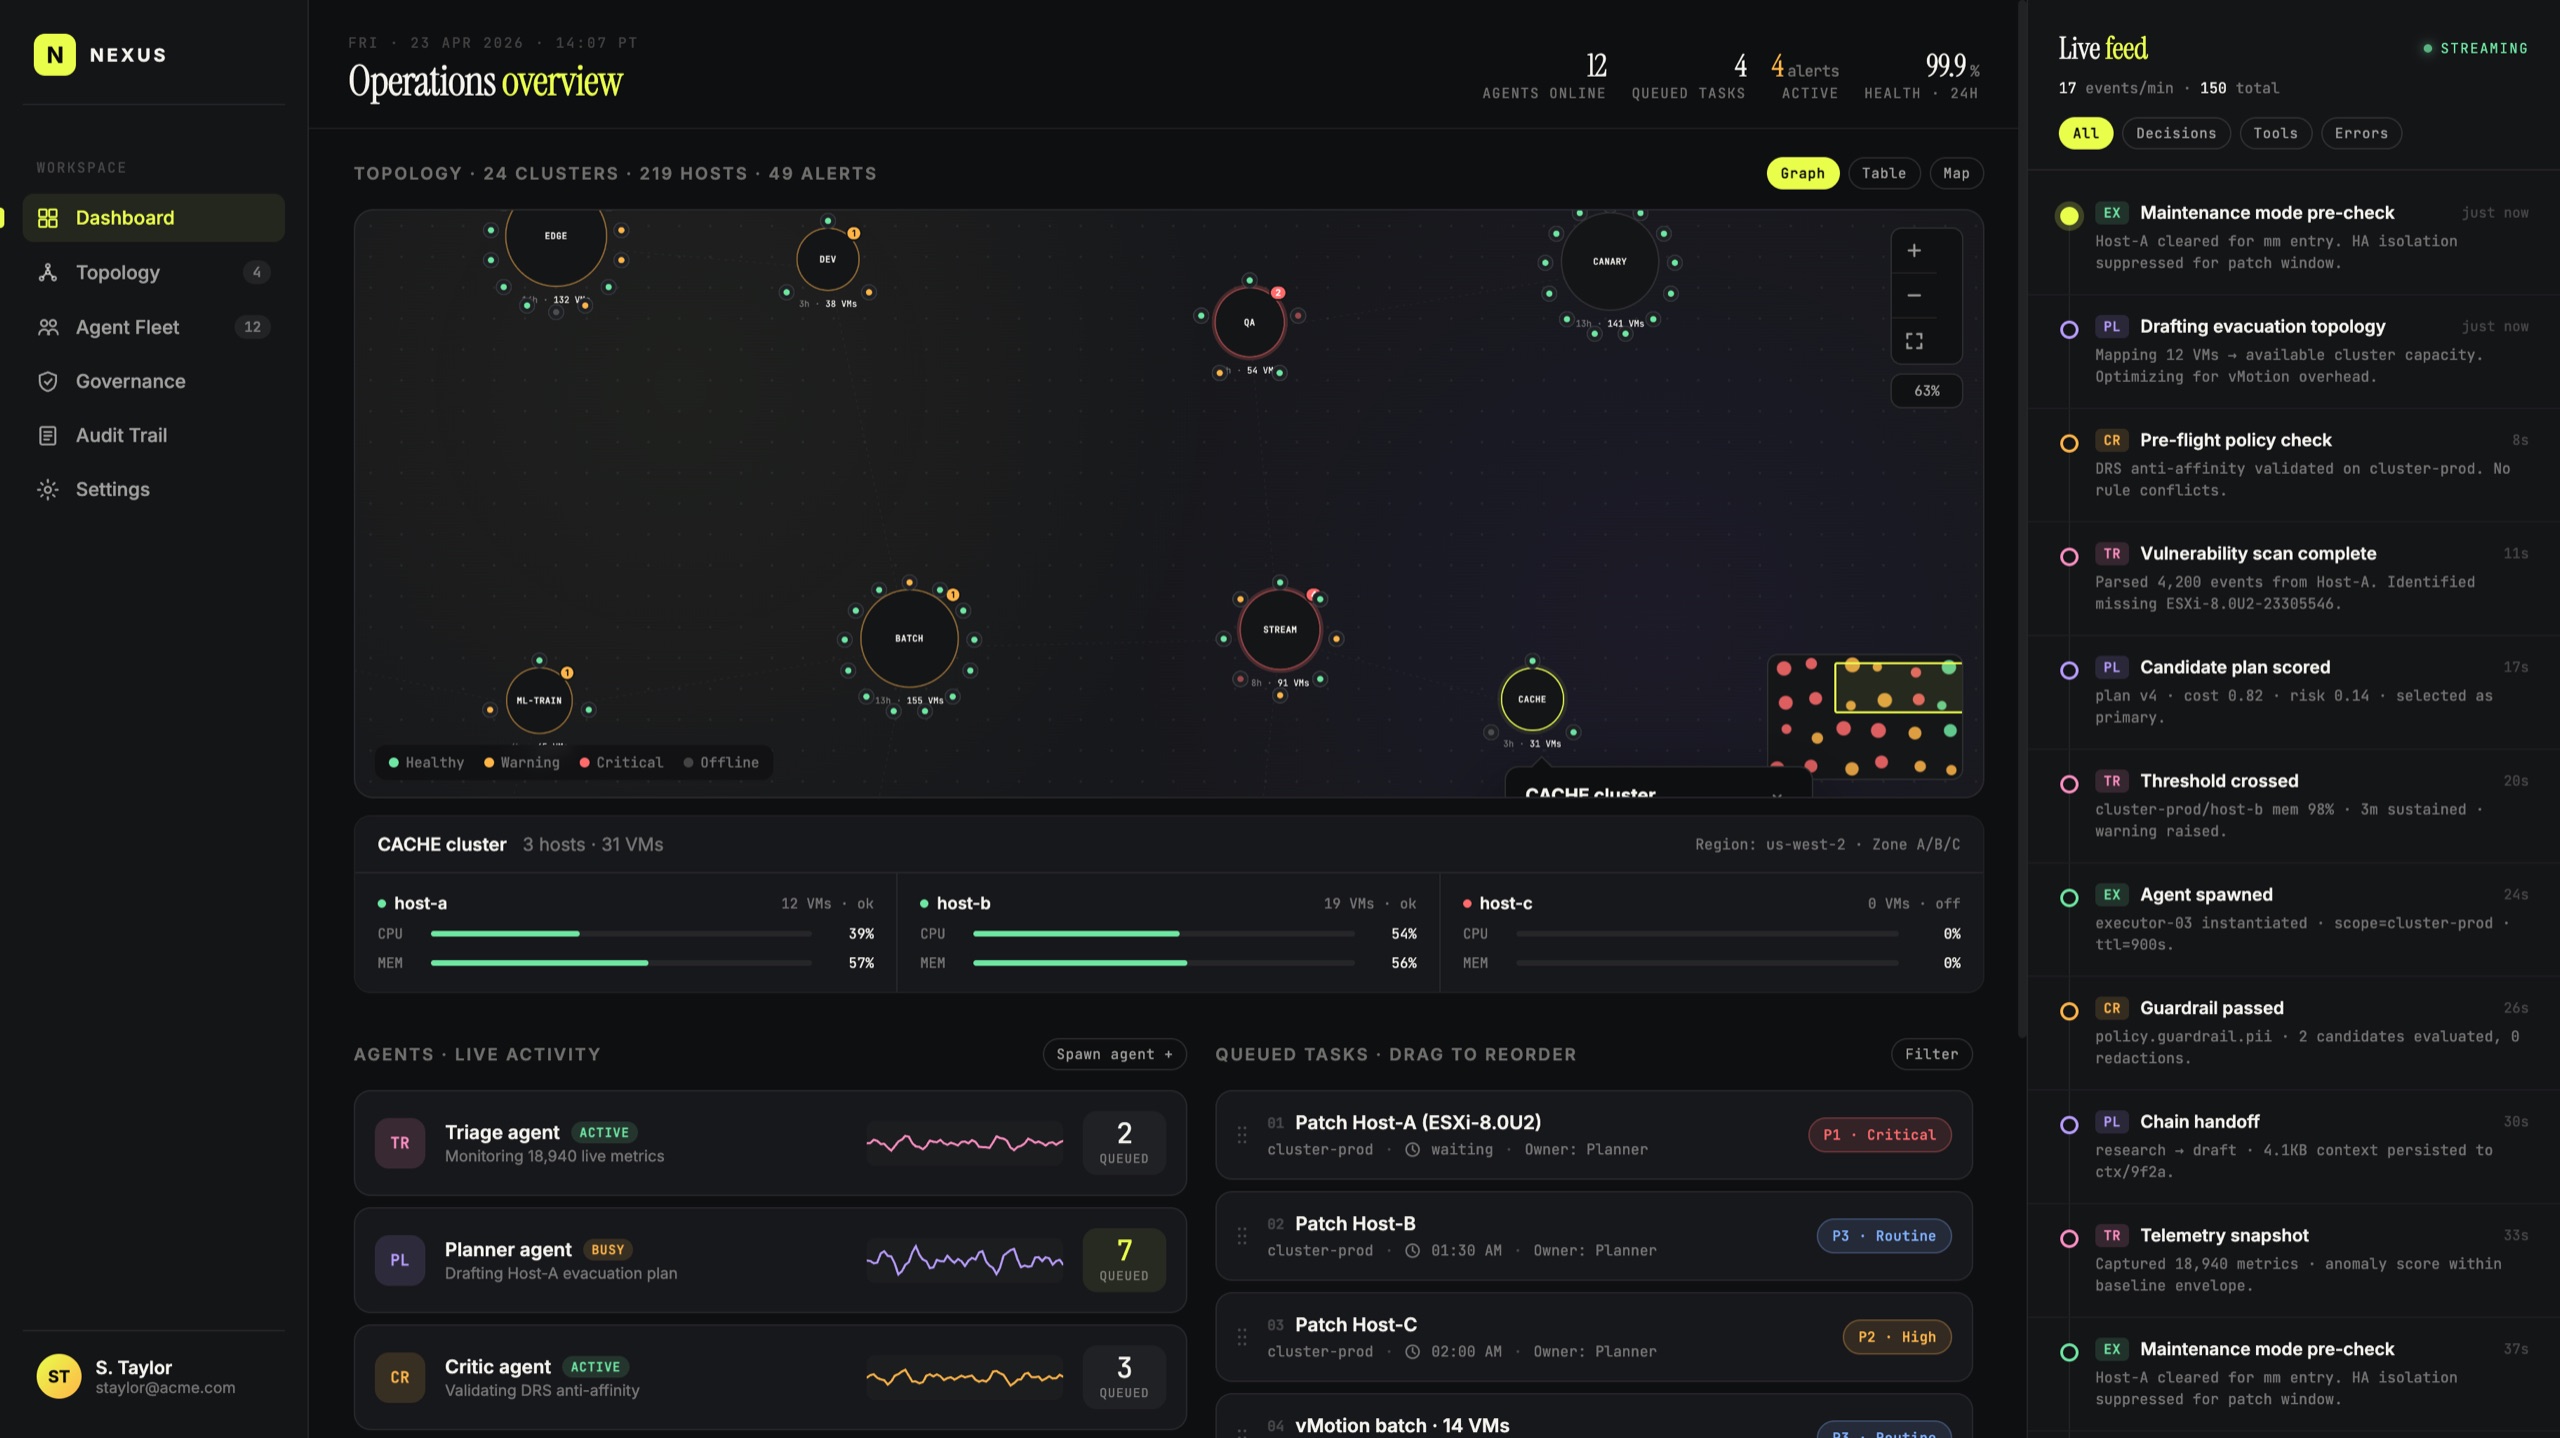
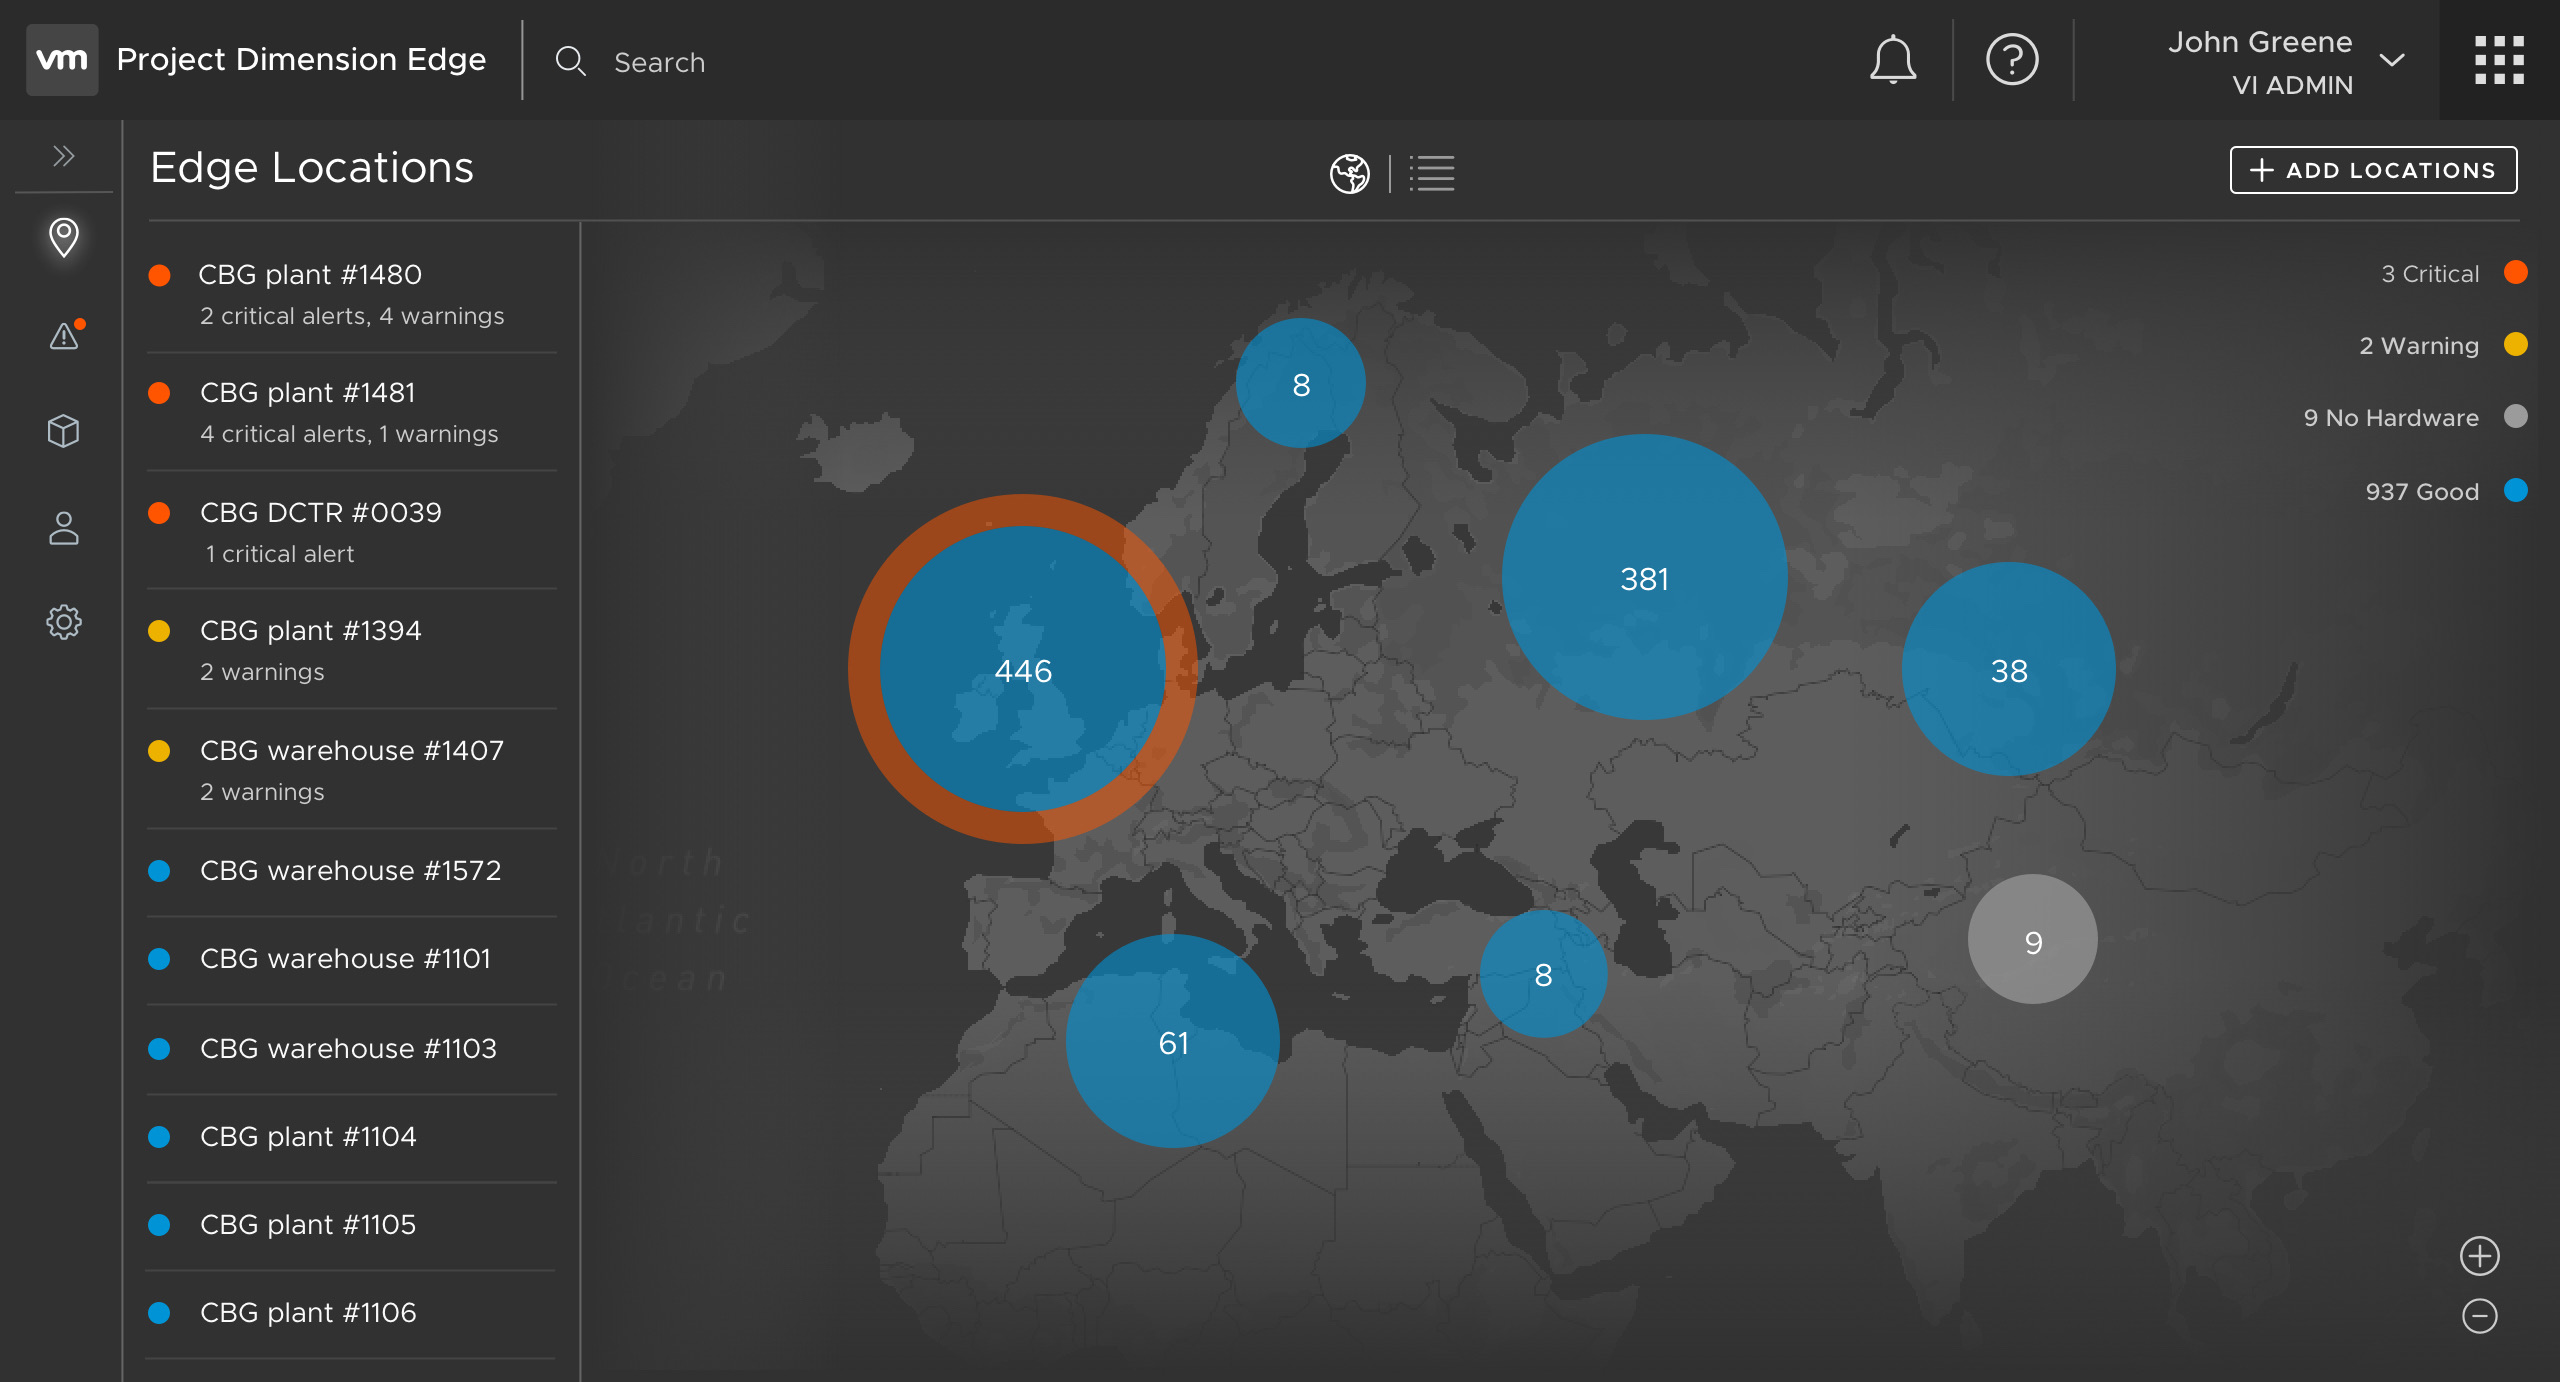
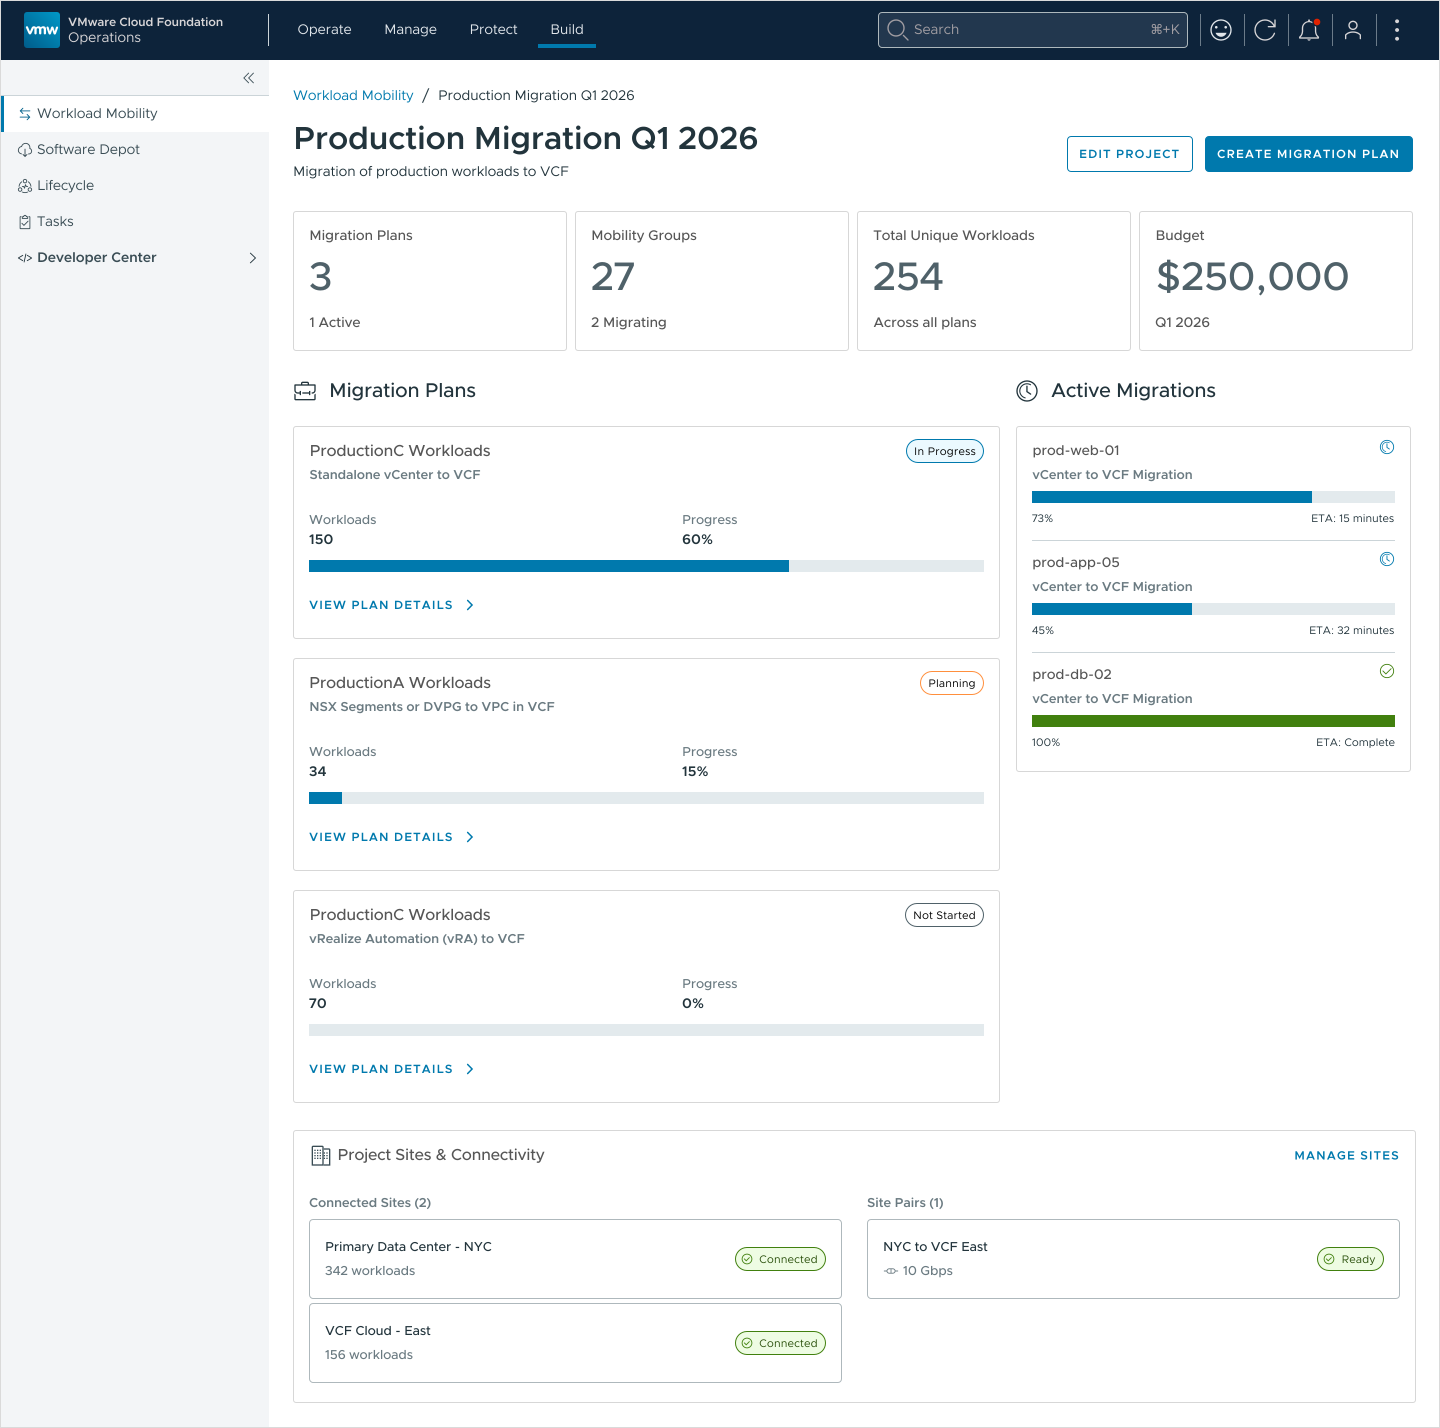
Project Dashboard
A level above the migration plan. Large efforts like a datacenter exit span many plans; a project shows every plan, active migration, and site connection in one place. Who needs this view most was an open question for user testing.
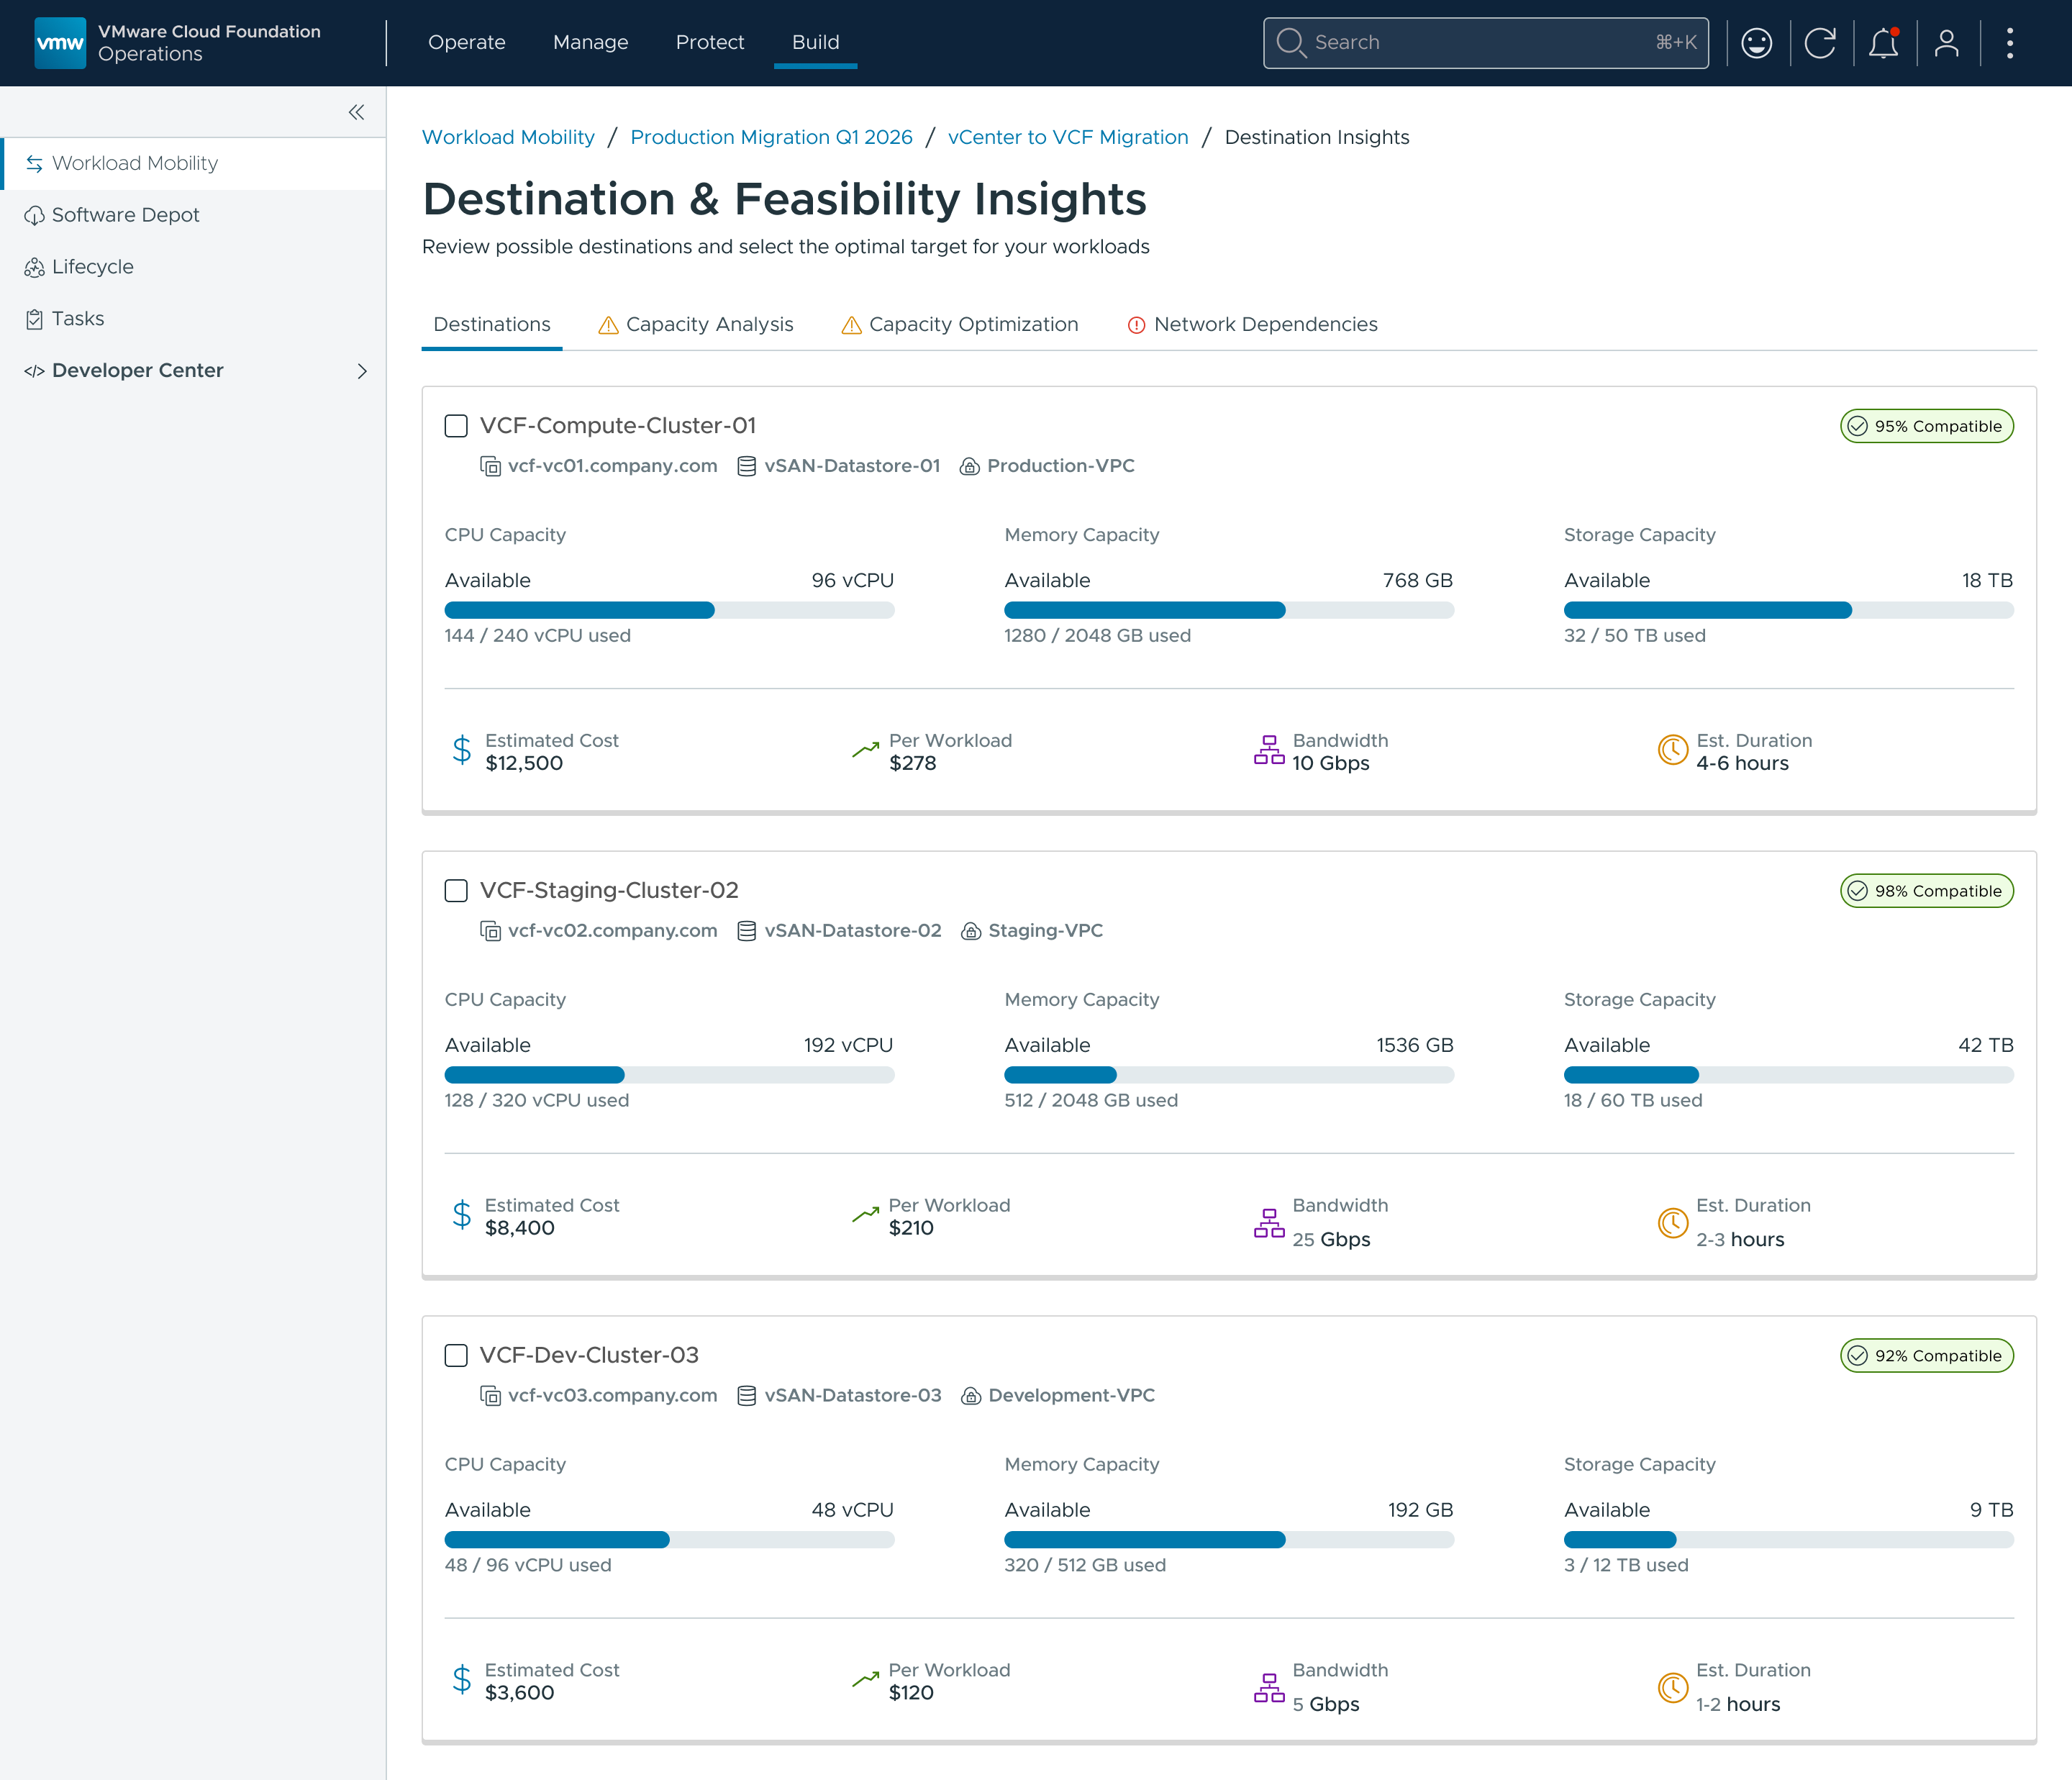
Destination Insights
Closes the blind spot. Candidate clusters compared by capacity, cost, and compatibility, so operators choose a destination with the data in front of them instead of assembling it from other tools.
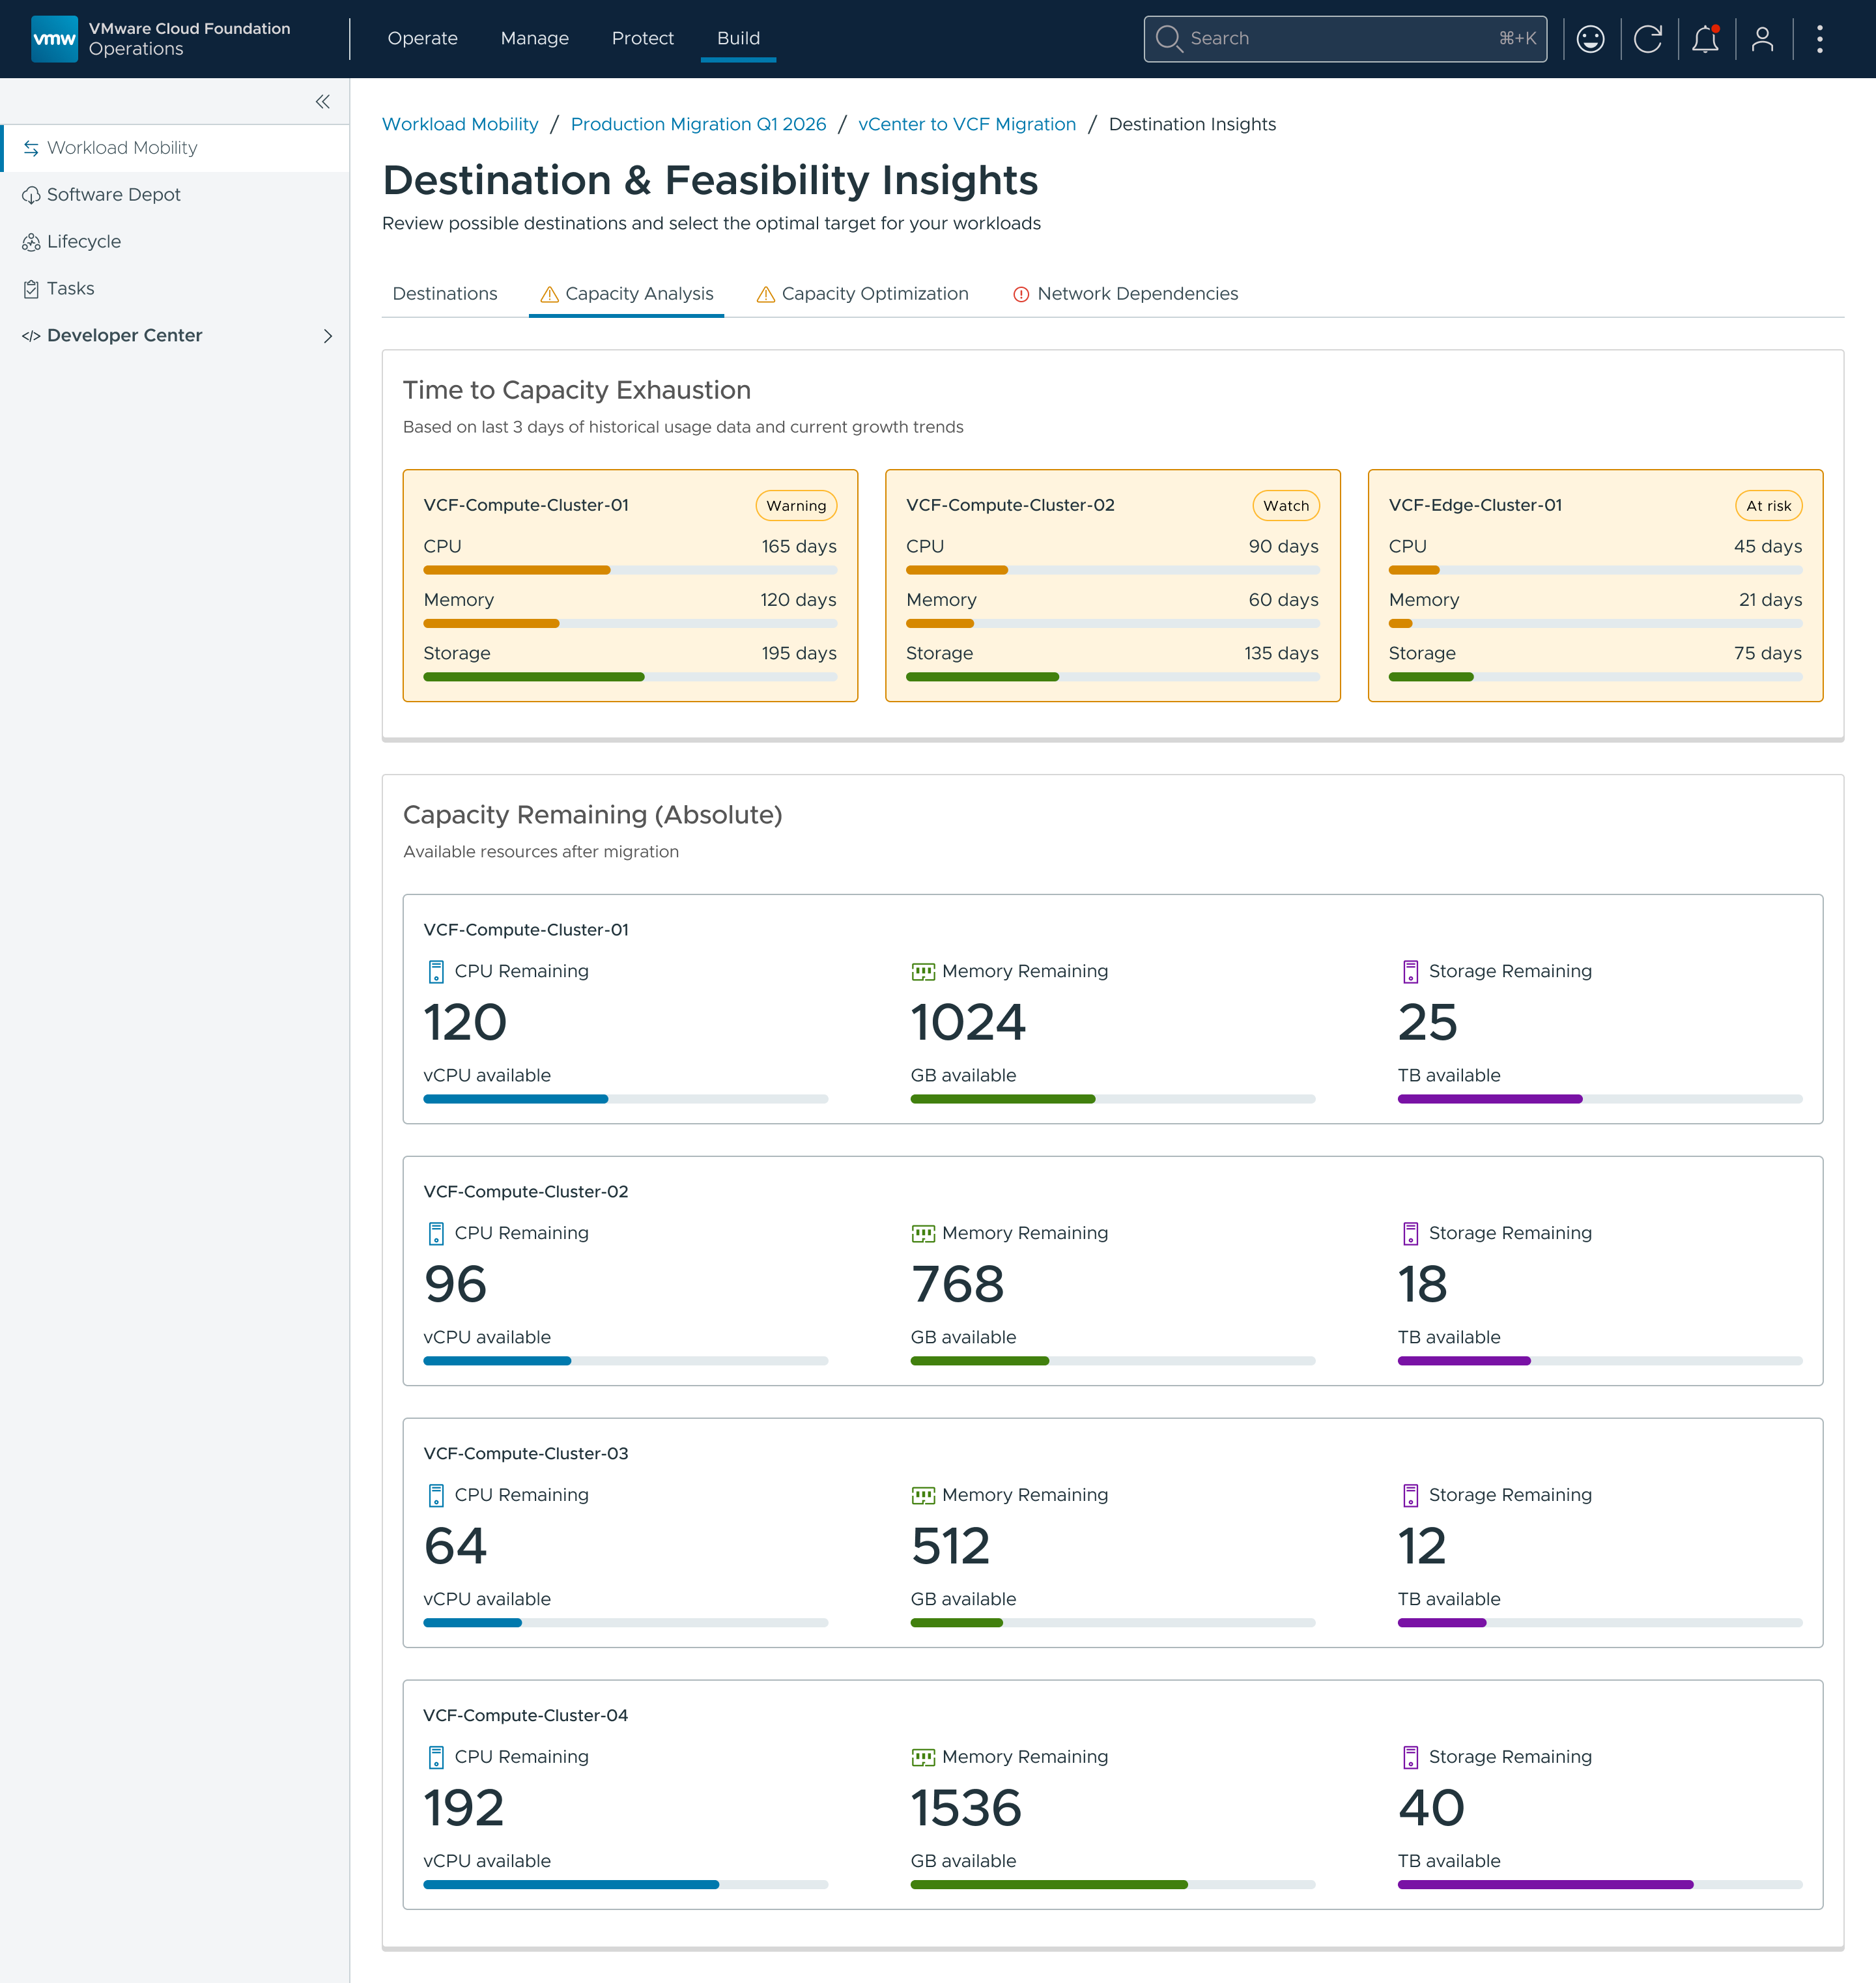
Capacity Analysis
Live, not a snapshot. Forecasted CPU, memory, and storage use across waves, built on live capacity data so a plan doesn't go stale while it's being built.
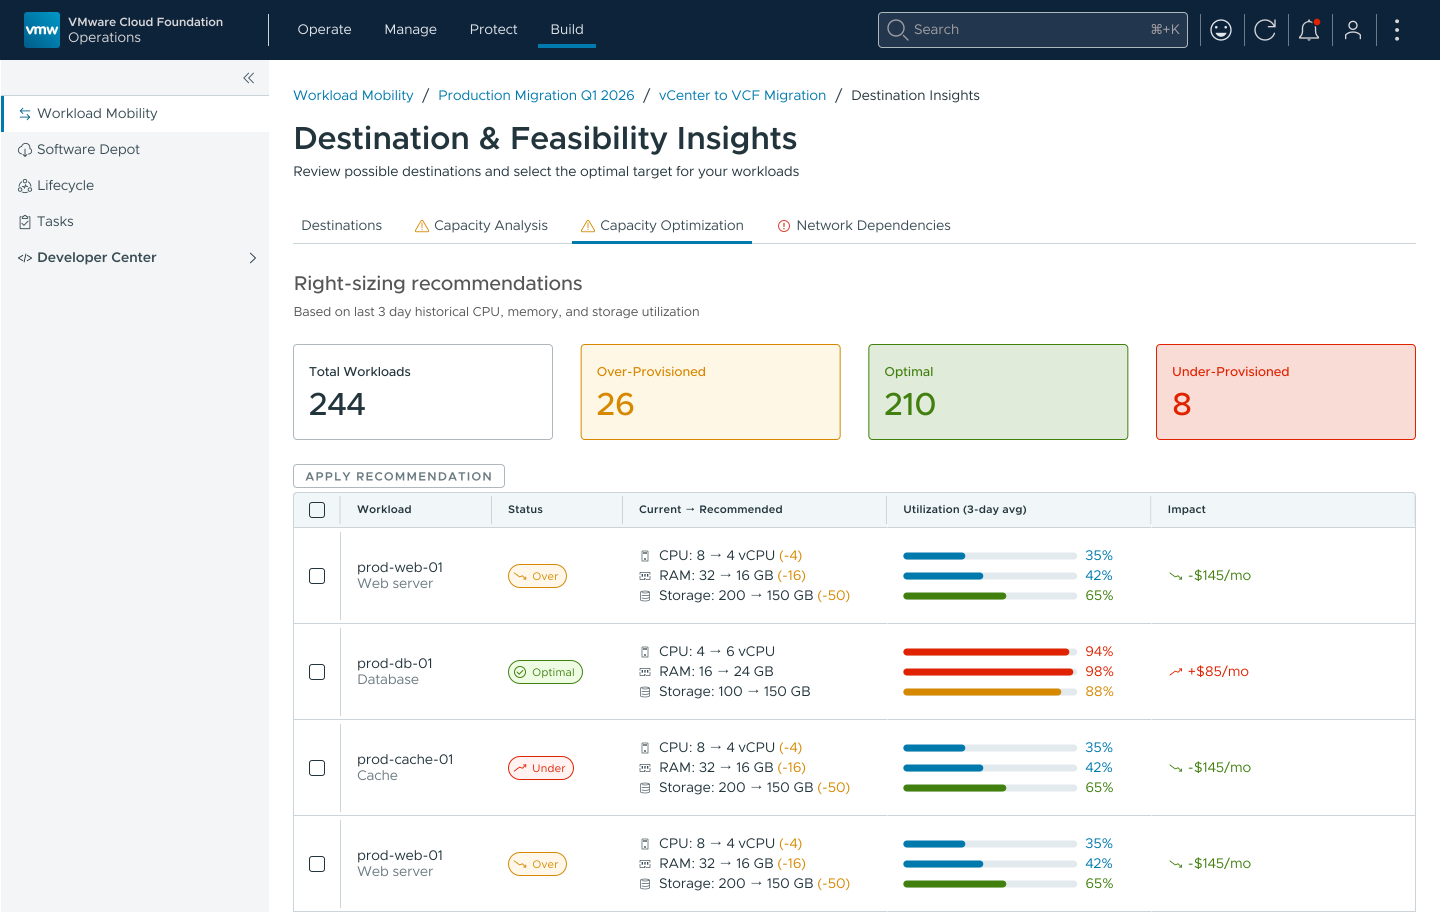
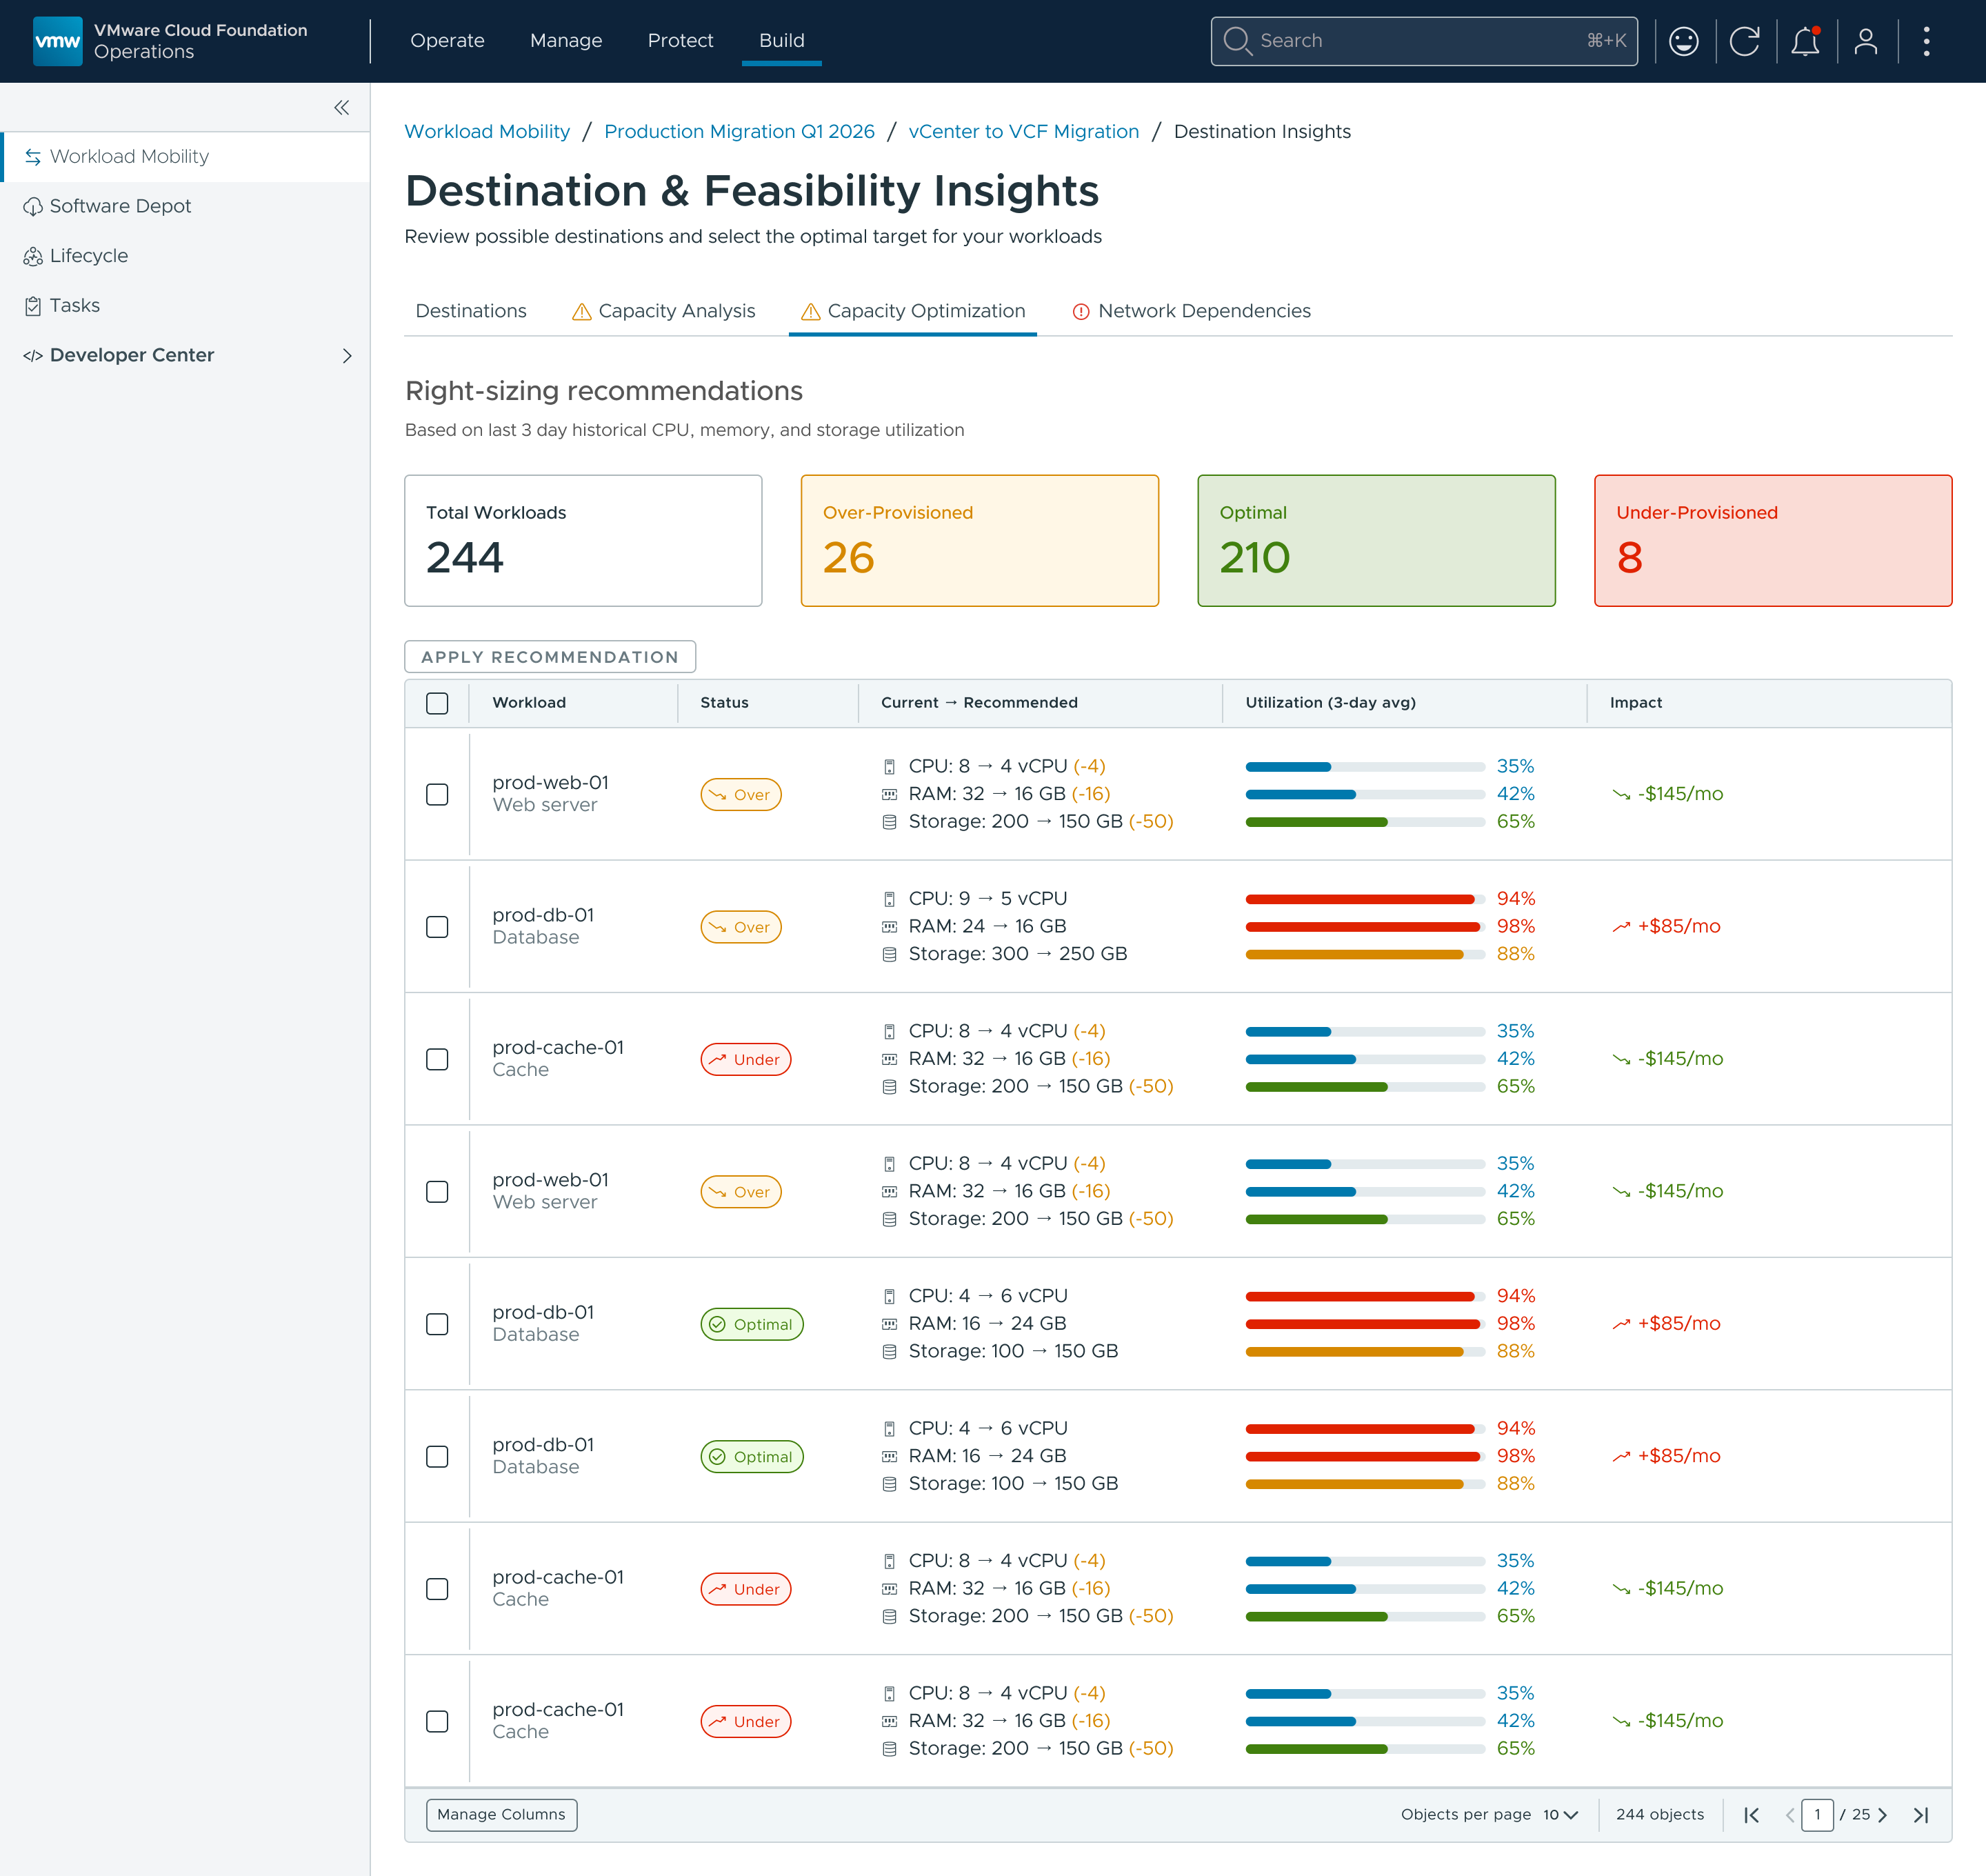
Capacity Optimization
Right-size workloads before they move. Smaller VMs mean less data crossing the network, making better use of bandwidth during migration.
What this project taught me.
Automation runs on trust
Operators wouldn't rely on generated waves until the logic weighed more than network dependencies. Showing why the system grouped VMs the way it did matters as much as the grouping itself.
Design for the task, not the architecture
A "send, then commit" flow mirrored the boundary between two systems. Holding out for a single Commit kept the workflow shaped around what operators were trying to do.
Mentoring as a working model
I mapped each workflow end to end in hi-fi; the designer I mentored completed the remaining screens across our US–India time difference, and we alternated moderating research sessions. That freed me to manage stakeholders and present the redesign's results to executives.
The research was mostly qualitative. I'd set up quantitative baselines from the start — failure rates, time to build a migration plan, time to execute one — so design decisions, and the results afterward, could be measured against the legacy flow.